• Chinese Optics Letters
  • Vol. 18, Issue 12, 123801 (2020)
Akinao Nakamura1, Tomoki Mizuta1, Yasuhiko Shimotsuma1、*, Masaaki Sakakura1, Tomohito Otobe2, Masahiro Shimizu1, and Kiyotaka Miura1
Author Affiliations
  • 1Department of Material Chemistry, Graduate School of Engineering, Kyoto University, Kyoto 615-8510, Japan
  • 2National Institutes for Quantum and Radiological Science and Technology, Kansai Photon Science Institute, Kyoto 619-0215, Japan
  • show less
    DOI: 10.3788/COL202018.123801 Cite this Article Set citation alerts
    Akinao Nakamura, Tomoki Mizuta, Yasuhiko Shimotsuma, Masaaki Sakakura, Tomohito Otobe, Masahiro Shimizu, Kiyotaka Miura. Picosecond burst pulse machining with temporal energy modulation [Invited][J]. Chinese Optics Letters, 2020, 18(12): 123801 Copy Citation Text show less
    Schematics of pulse trains (a) with and (b) without temporal pulse energy modulation. Sequential snapshots of plasma in alkali silicate glass induced by picosecond laser irradiation (c) with and (d) without temporal pulse energy modulation. The 48 snapshots with a frame rate of 45,000 fps were taken from the direction perpendicular to the laser propagation. The time-averaged pulse energy was set to be 5 μJ. Yellow dotted lines represent the geometrical focus.
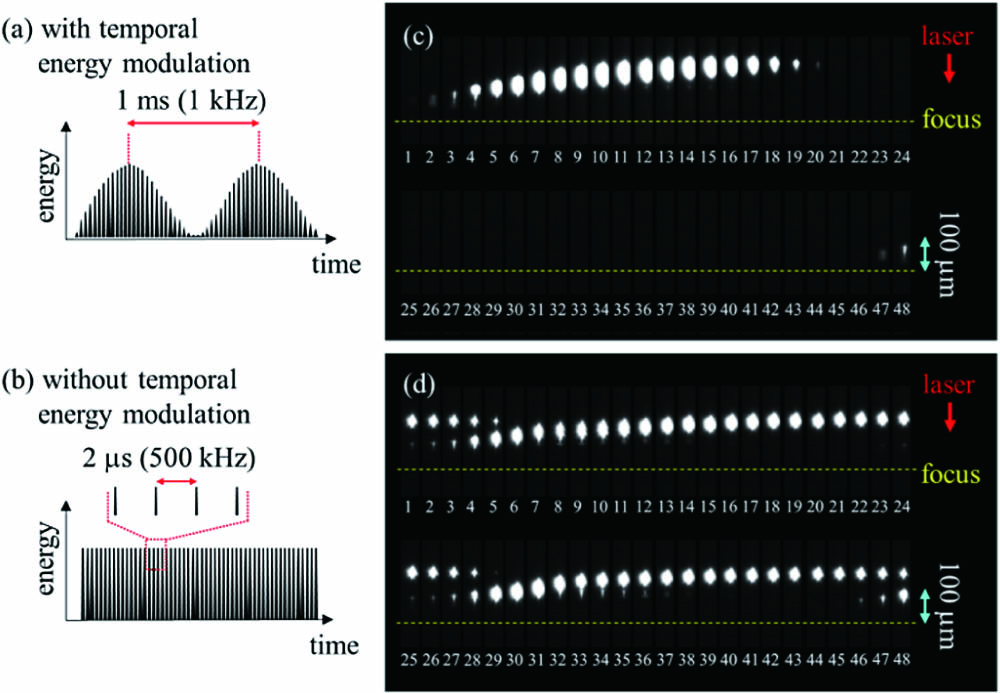
    Fig. 1. Schematics of pulse trains (a) with and (b) without temporal pulse energy modulation. Sequential snapshots of plasma in alkali silicate glass induced by picosecond laser irradiation (c) with and (d) without temporal pulse energy modulation. The 48 snapshots with a frame rate of 45,000 fps were taken from the direction perpendicular to the laser propagation. The time-averaged pulse energy was set to be 5 μJ. Yellow dotted lines represent the geometrical focus.
    (a) Plots of the movement cycle of plasma in an alkali silicate glass sample induced by picosecond laser irradiation with and without pulse energy modulation. (b) Plots of the movement cycle of plasma during laser irradiation with pulse energy modulation in a shape of sine wave with various frequencies. The dashed line of y=x is for an eye guide.
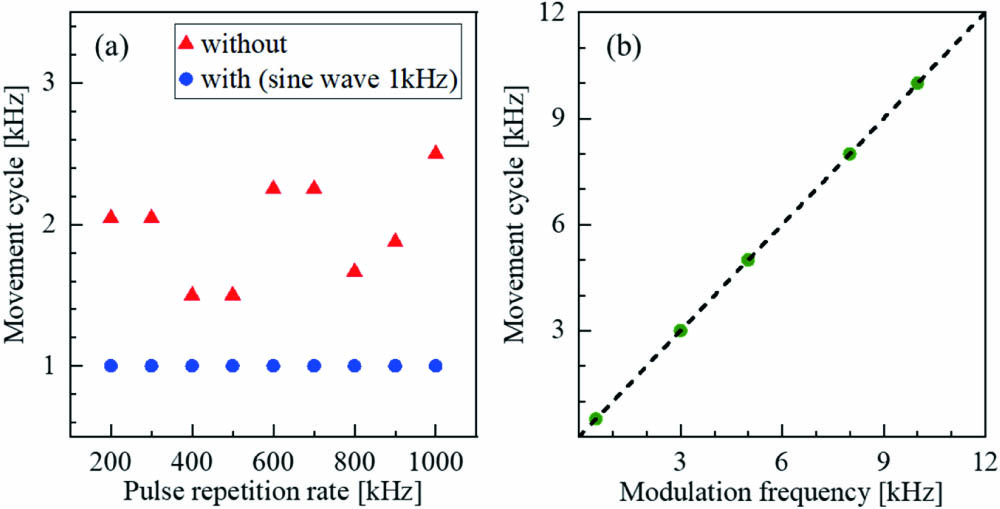
    Fig. 2. (a) Plots of the movement cycle of plasma in an alkali silicate glass sample induced by picosecond laser irradiation with and without pulse energy modulation. (b) Plots of the movement cycle of plasma during laser irradiation with pulse energy modulation in a shape of sine wave with various frequencies. The dashed line of y=x is for an eye guide.
    Optical micrographs of modified tracks in an alkali silicate glass sample written by laser pulses with different pulse widths of (a) 400 fs and (b), (c) 10 ps. The pulse energy modulation was performed for writing the tracks in (c). The profiles of the phase retardation along the dotted yellow lines are also shown in (d)–(f). The scale bar shows 20 μm.
    Fig. 3. Optical micrographs of modified tracks in an alkali silicate glass sample written by laser pulses with different pulse widths of (a) 400 fs and (b), (c) 10 ps. The pulse energy modulation was performed for writing the tracks in (c). The profiles of the phase retardation along the dotted yellow lines are also shown in (d)–(f). The scale bar shows 20 μm.
    Time-resolved observation of the phase retardation around the focus of the picosecond laser pulses with and without pulse energy modulation. The inset shows the magnified plots ranging from 200 ms to 220 ms.
    Fig. 4. Time-resolved observation of the phase retardation around the focus of the picosecond laser pulses with and without pulse energy modulation. The inset shows the magnified plots ranging from 200 ms to 220 ms.
    Simulation of the electric field distribution inside the alkali silicate glass induced by the focused paraxial Gaussian laser beams (a) with and (b) without pulse energy modulation. The time sequential calculation of the electric field distribution is successively shown from left to right. In the calculation, the region in which the electric field intensity exceeded a threshold for plasma generation (white area) was set to be a perfect conductor.
    Fig. 5. Simulation of the electric field distribution inside the alkali silicate glass induced by the focused paraxial Gaussian laser beams (a) with and (b) without pulse energy modulation. The time sequential calculation of the electric field distribution is successively shown from left to right. In the calculation, the region in which the electric field intensity exceeded a threshold for plasma generation (white area) was set to be a perfect conductor.
    Akinao Nakamura, Tomoki Mizuta, Yasuhiko Shimotsuma, Masaaki Sakakura, Tomohito Otobe, Masahiro Shimizu, Kiyotaka Miura. Picosecond burst pulse machining with temporal energy modulation [Invited][J]. Chinese Optics Letters, 2020, 18(12): 123801
    Download Citation