
Xieyi HUANG, Peng WANG, Guoheng YIN, Shaoning ZHANG, Wei ZHAO, Dong WANG, Qingyuan BI, Fuqiang HUANG. Removal of Volatile Organic Compounds Driven by Platinum Supported on Amorphous Phosphated Titanium Oxide [J]. Journal of Inorganic Materials, 2020, 35(4): 482
- Journal of Inorganic Materials
- Vol. 35, Issue 4, 482 (2020)
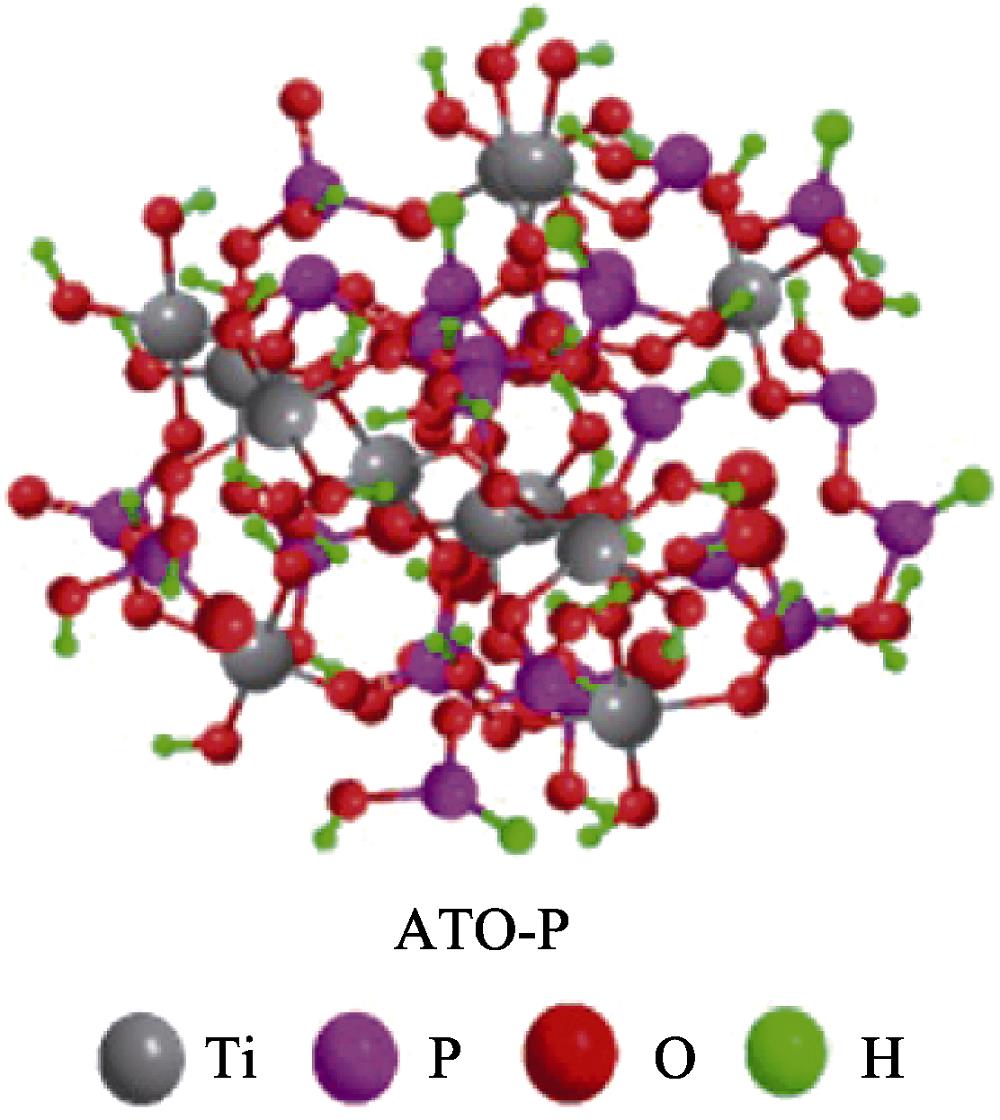
1. Structure of amorphous ATO-P prepared via facile co-precipitation
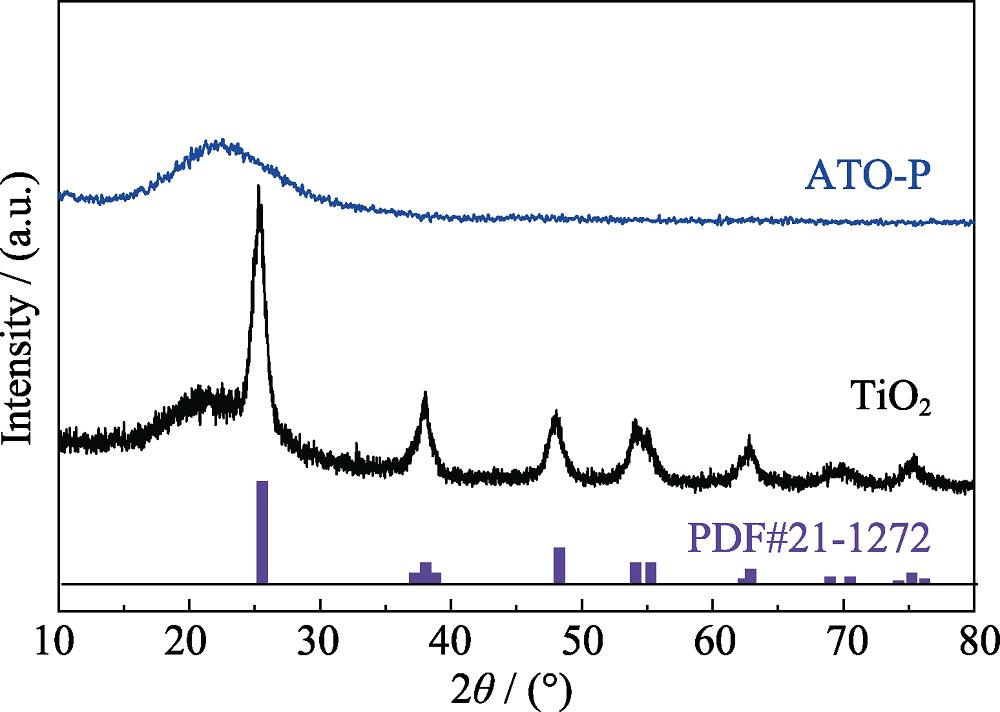
2. XRD patterns of TiO2 and ATO-P samples
3. TG (solid line) and DSC (dashed line) curves for ATO-P
4. SEM (a, b) and HRTEM (c) images, and EDS elemental mapping (d) of ATO-P
5. N2 adsorption-desorption isotherms (a) and pore size distributions (b) of ATO-P and TiO2
6. FT-IR spectra of TiO2 and ATO-P
7. Full XPS spectra (a) of TiO2 and ATO-P; High-resolution XPS P2p (b), Ti2p (c), and O1s (d) of TiO2 and ATO-P
8. TEM (a) and HRTEM (b) images of Pt/ATO-P with insert in (a) indicating the particle size distribution of Pt nanoparticles, XRD patterns (c) and XPS Pt4f (d) of Pt/ATO-P
9. Toluene conversion (a) of 1wt% Pt/ATO-P with respect to reaction temperature, and thermal stability (b) of Pt/ATO-P at 180 ℃
10. Toluene conversion over Pt/ATO-P catalysts with different Pt loadings
11. Catalytic activity of Pt/ATO-P for the conversion of benzene (a), ethyl acetate (b), n -hexane (c), and mesitylene (d) with respect to reaction temperature
S1. SEM (a) and HRTEM (b) images of TiO2
S2. HRTEM image of Pt/ATO-P
S3. H2-TPR profiles of Pt/TiO2 and Pt/ATO-P samples
S4. TEM images of 0.5wt% Pt/ATO-P (a) and 2wt% Pt/ATO-P (b) For the catalyst with low loading of 0.5wt%, there are few Pt nanoparticles in the ATO-P supports. By contract, the Pt particles are larger than that with loading of 1wt% when the loading up to 2wt%
S5. TEM (a) and HRTEM (b) images of the used Pt/ATO-P catalyst
S6. XPS Pt 4f spectra of the fresh and the used Pt/ATO-P catalysts
| ||||||||||||||||||||||||
Table 1.
Textural properties and elemental compositions of TiO2 and ATO-P samples

Set citation alerts for the article
Please enter your email address
© Copyright 2018-2021 | Chinese Laser Press. All Rights Reserved 沪ICP备15018463号-20