• Spectroscopy and Spectral Analysis
  • Vol. 42, Issue 11, 3403 (2022)
Jia-min CHEN1、*, Bo-yan LI1、1; *;, Yun HU2、2;, Jin ZHANG1、1;, Rui-min WANG1、1;, and Xiao-hong SUN1、1;
Author Affiliations
  • 11. School of Public Health/Key Laboratory of Environmental Pollution Monitoring and Disease Control, Ministry of Education, Guizhou Medical University, Guiyang 550025, China
  • 22. Technology Center, China Tobacco Guizhou Industrial Co. Ltd., Guiyang 550009, China
  • show less
    DOI: 10.3964/j.issn.1000-0593(2022)11-3403-06 Cite this Article
    Jia-min CHEN, Bo-yan LI, Yun HU, Jin ZHANG, Rui-min WANG, Xiao-hong SUN. Phytochemical Active Composites in Rosa Roxburghii Tratt.: Content Distribution and Spectroscopic Characterization[J]. Spectroscopy and Spectral Analysis, 2022, 42(11): 3403 Copy Citation Text show less
    (a) UV-Vis-NIR fusion spectra of the RRT extract samples and (b) fluorescence excitation-emission matrix (EEM) spectra of a typical extract and its 50 times-diluted (inset after Rayleigh scattering being removed) solution
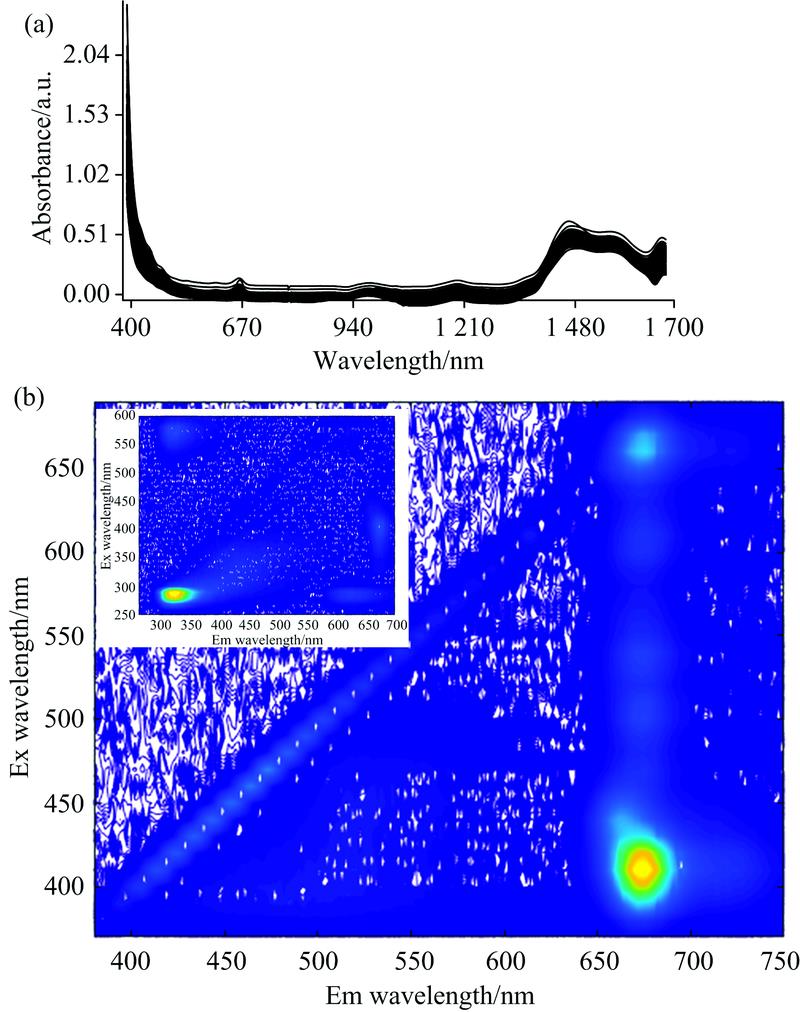
    Fig. 1. (a) UV-Vis-NIR fusion spectra of the RRT extract samples and (b) fluorescence excitation-emission matrix (EEM) spectra of a typical extract and its 50 times-diluted (inset after Rayleigh scattering being removed) solution
    PDV discrimination scores of UV-Vis-NIR spectral data of the RRT extracts after being 2nd derivative-pretreated; Inset illustrates the discriminant scores of 51 RRT extracts originated from AS
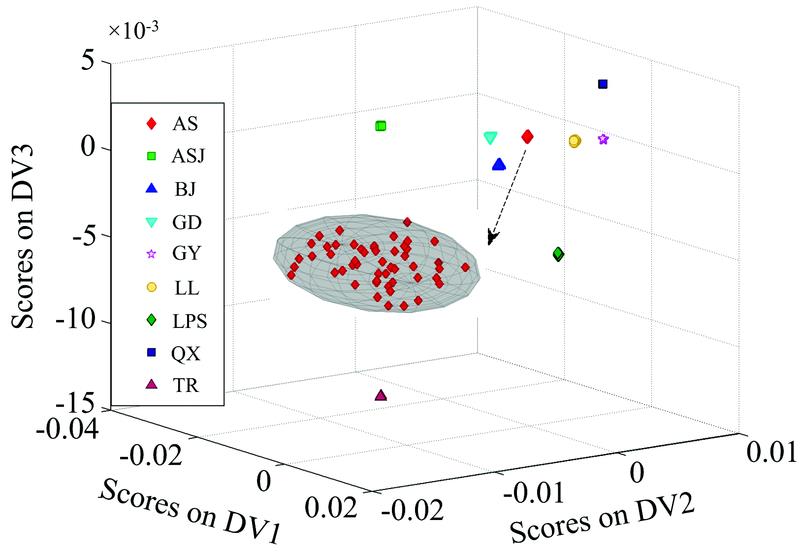
    Fig. 2. PDV discrimination scores of UV-Vis-NIR spectral data of the RRT extracts after being 2nd derivative-pretreated; Inset illustrates the discriminant scores of 51 RRT extracts originated from AS
    OriginSample
    size (n)
    Range
    TPC/
    (mg·g-1 FW)
    TFC/
    (mg·g-1 FW)
    TTC/
    (mg·g-1 FW)
    DPPH/
    %
    FRAP/
    (mmol·L-1 TE·g-1 FW)
    ABTS/
    %
    AS5611.92~28.6210.63~27.967.34~19.9914.39~65.490.17~0.3624.16~49.90
    ASJ109.28~27.5814.80~20.3610.53~17.6321.73~57.050.13~0.3118.95~46.45
    BJ5011.74~37.459.56~23.637.02~22.6216.08~83.190.13~0.4418.50~68.45
    GD5010.04~26.9210.56~20.336.91~20.0219.60~75.040.08~0.4418.53~53.29
    GY229.23~29.749.70~21.567.97~15.8229.81~67.110.14~0.2918.73~48.56
    LL5013.09~26.428.80~25.138.65~19.7520.04~75.990.17~0.3121.03~51.08
    LPS5512.34~28.049.76~24.068.21~17.1129.15~65.420.19~0.2926.51~47.10
    QX412.25~28.1915.76~21.939.41~14.2934.88~70.700.19~0.2824.90~52.80
    TR410.81~26.4111.90~21.2011.85~18.8026.21~48.680.14~0.2618.78~40.61
    Table 1. Sample information of RRT fruits used in this study
    ParametersSample
    size (n)
    Rangemean±stdNormality testr
    statisticp-value
    TPC28610.04~28.19 mg·g-1 FW18.99±3.51 mg·g-1 FW0.030.200.98
    TFC2878.79~23.63 mg·g-1 FW15.81±2.87 mg·g-1 FW0.030.200.99
    TTC2866.91~19.24 mg·g-1 FW12.90±2.37 mg·g-1 FW0.040.200.98
    DPPH28222.33%~67.11%45.45%±8.4%0.030.200.98
    FRAP2740.17~0.31 mmol·L-1 TE·g-1 FW0.24±0.03 mmol·L-1 TE·g-1 FW0.040.200.97
    ABTS27921.03%~49.90%35.73%±5.40%0.040.200.97
    Table 2. Description of phytochemicals and antioxidant activities of RRT extracts in terms of distributing characteristics
    PreprocessingRatio of SSbetween to SSwithin of two sample sets from different regions
    AS vs. BJAS vs. LPSLL vs. GDLL vs. GYGD vs. GY
    MC6.8219.484.582.373.64
    MSC+MC5.09×1032.03×1044.72×1031.41×1024.24×103
    2nd Deriv+MC7.3218.113.702.763.41
    Table 3. Analysis of SSbetween to SSwithin of two RRT extract sample sets from typical regions resulted from the EEM spectra with different preprocessing
    Jia-min CHEN, Bo-yan LI, Yun HU, Jin ZHANG, Rui-min WANG, Xiao-hong SUN. Phytochemical Active Composites in Rosa Roxburghii Tratt.: Content Distribution and Spectroscopic Characterization[J]. Spectroscopy and Spectral Analysis, 2022, 42(11): 3403
    Download Citation