• Laser & Optoelectronics Progress
  • Vol. 59, Issue 1, 0114012 (2022)
Wanxu Liang1, Yong Yang1、*, Kang Jin1, Kang Qi1, Li Xiong1, Yi Liu2, and Longjie Dai2
Author Affiliations
  • 1School of Mechanical and Automotive Engineering, Qingdao University of Technology, Qingdao , Shandong 266520, China
  • 2Qingdao Choho Industrial Co., Ltd., Qingdao , Shandong 266705, China
  • show less
    DOI: 10.3788/LOP202259.0114012 Cite this Article Set citation alerts
    Wanxu Liang, Yong Yang, Kang Jin, Kang Qi, Li Xiong, Yi Liu, Longjie Dai. Morphology Prediction of Coaxial Powder Feeding Multichannel Laser Cladding Layer Based on Response Surface[J]. Laser & Optoelectronics Progress, 2022, 59(1): 0114012 Copy Citation Text show less
    Laser cladding equipment
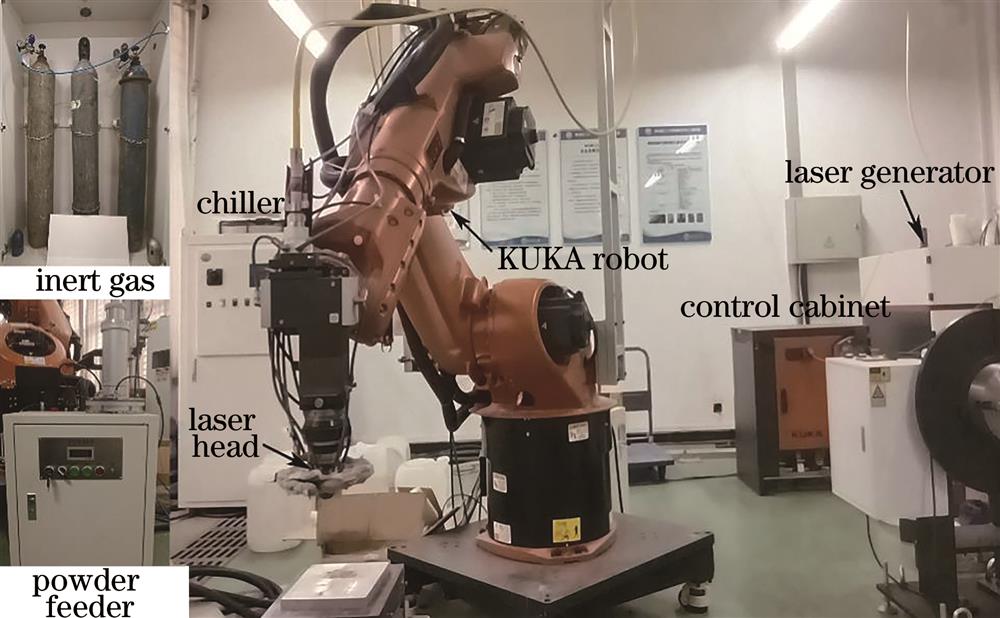
    Fig. 1. Laser cladding equipment
    Schematic of coaxial powder feeding multi-channel laser cladding
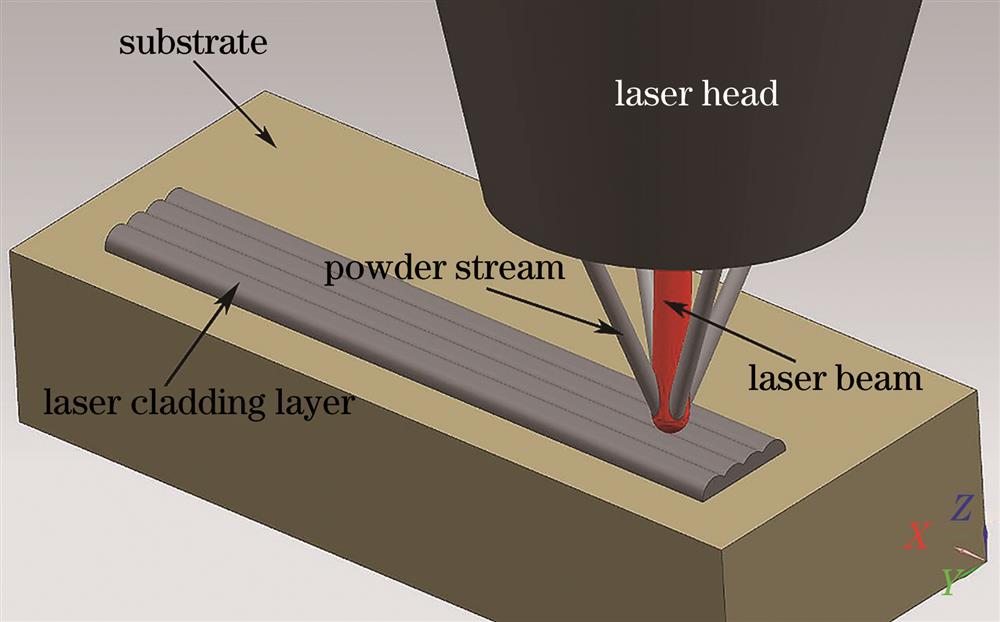
    Fig. 2. Schematic of coaxial powder feeding multi-channel laser cladding
    Section morphology of cladding layer
    Fig. 3. Section morphology of cladding layer
    Cross-sectional morphologies of cladding layers of each sample. (a) Sample 10; (b) sample 20; (c) sample 30; (d) sample 40; (e) sample 50; (f) sample 60; (g) sample 70; (h) sample 80; (i) sample 90
    Fig. 4. Cross-sectional morphologies of cladding layers of each sample. (a) Sample 10; (b) sample 20; (c) sample 30; (d) sample 40; (e) sample 50; (f) sample 60; (g) sample 70; (h) sample 80; (i) sample 90
    Effect Pareto diagram of average height of cladding layer
    Fig. 5. Effect Pareto diagram of average height of cladding layer
    Effect Pareto diagram of average substrate melt depth
    Fig. 6. Effect Pareto diagram of average substrate melt depth
    Three-dimensional response surfaces of average substrate melt depth under different significant interaction terms. (a) Laser power P and distance from cladding head to the substrate L; (b) overlap rate Or and distance from cladding head to the substrate L; (c) scanning speed S and overlap rate Or
    Fig. 7. Three-dimensional response surfaces of average substrate melt depth under different significant interaction terms. (a) Laser power P and distance from cladding head to the substrate L; (b) overlap rate Or and distance from cladding head to the substrate L; (c) scanning speed S and overlap rate Or
    Effect Pareto diagram of average dilution rate
    Fig. 8. Effect Pareto diagram of average dilution rate
    Three-dimensional response surfaces of average dilution rate under different significant interaction terms. (a) Scanning speed S and overlap rate Or; (b) distance from cladding head to the substrate L and laser power P; (c) distance from cladding head to the substrate L and scanning speed S
    Fig. 9. Three-dimensional response surfaces of average dilution rate under different significant interaction terms. (a) Scanning speed S and overlap rate Or; (b) distance from cladding head to the substrate L and laser power P; (c) distance from cladding head to the substrate L and scanning speed S
    Effect Pareto diagram of average surface height difference
    Fig. 10. Effect Pareto diagram of average surface height difference
    Three-dimensional response surfaces of average surface height difference under different significant interaction terms. (a) Overlap rate Or and laser power P; (b) distance from cladding head to the substrate L and overlap rate Or
    Fig. 11. Three-dimensional response surfaces of average surface height difference under different significant interaction terms. (a) Overlap rate Or and laser power P; (b) distance from cladding head to the substrate L and overlap rate Or
    Cladding layer morphologies after optimization.(a) Surface morphology; (b) cross-sectional morphology
    Fig. 12. Cladding layer morphologies after optimization.(a) Surface morphology; (b) cross-sectional morphology
    MaterialMass fraction /%
    CSiMnSPCrNiMoCu
    45 steel0.460.270.65--0.230.3-0.24
    316L powder0.070.901.900.030.03517.5122.5-
    Table 1. Chemical composition of 45 steel and 316L stainless steel powder
    VariableNotationValue
    Laser powerP /kW1.0,1.2,1.4
    Scanning speedS /mms-15,7,9
    Overlap rateOr /%10,20,30,40,50
    Distance from cladding head to substrateL /mm1.5,2.0
    Table 2. Process parameter values
    No.P /kWS /mms-1Or /%L /mmH /mmH' /mmΔ1 /%
    Average10.09
    101.05101.50.9340.8459.53
    201.25301.50.8860.9082.49
    301.45202.00.7950.7920.37
    401.07102.00.3280.41827.46
    501.27302.00.5710.48115.82
    601.47401.50.6790.78916.20
    701.09402.00.2560.2502.51
    801.29501.50.6090.5588.39
    901.49502.00.4630.4268.01
    Table 3. Predicted average height of cladding layers
    No.P /kWS /mms-1Or /%L /mmD /mmD' /mmΔ2 /%
    Average4.96
    101.05101.50.1470.1491.02
    201.25301.50.3270.3496.64
    301.45202.00.6380.5937.08
    401.07102.00.2210.19710.97
    501.27302.00.3930.3900.95
    601.47401.50.4260.4093.96
    701.09402.00.1250.1379.71
    801.29501.50.2290.2271.11
    901.49502.00.4420.4292.98
    Table 4. Predicted average substrate melt depth
    No.P /kWS /(mm⋅s-1Or /%L /mmDr /%Dr' /%Δ3 /%
    Average8.83
    101.05101.515.512.618.77
    201.25301.528.327.62.59
    301.45202.045.544.81.46
    401.07102.032.231.03.81
    501.27302.040.745.210.89
    601.47401.532.534.45.87
    701.09402.032.639.621.75
    801.29501.528.924.913.80
    901.49502.049.049.30.55
    Table 5. Predicted average dilution rate
    No.P /kWS /(mm⋅s-1Or /%L /mmAd /mmAd' /mmΔ4 /%
    Average8.34
    101.05101.50.3370.3224.32
    201.25301.50.2530.28211.58
    301.45202.00.2860.2734.47
    401.07102.00.2800.2903.27
    501.27302.00.1960.2002.40
    601.47401.50.2390.2629.85
    701.09402.00.1150.13719.54
    801.29501.50.2030.24018.03
    901.49502.00.1530.1551.58
    Table 6. Predicted average surface height difference
    No.P /kWS /(mm⋅s-1Or /%L /mmH /mmD /mmDr /%Ad /mm
    PredictI1.16301.40.7960.27023.60.272
    1.28451.40.6610.26724.60.261
    1.39451.30.7060.25923.30.266
    ExperimentalI1.16301.40.8290.24622.10.268
    1.28451.40.6980.42436.80.209
    1.39451.30.7760.31829.60.230
    Table 7. Optimization results and validation
    Wanxu Liang, Yong Yang, Kang Jin, Kang Qi, Li Xiong, Yi Liu, Longjie Dai. Morphology Prediction of Coaxial Powder Feeding Multichannel Laser Cladding Layer Based on Response Surface[J]. Laser & Optoelectronics Progress, 2022, 59(1): 0114012
    Download Citation