
Sabrina Relaix, Mykhailo Pevnyi, Wenyi Cao, and Peter Palffy-Muhoray, "Analytic solutions of the normal modes and light transmission of a cholesteric liquid crystal cell," Photonics Res. 1, 58 (2013)
- Photonics Research
- Vol. 1, Issue 1, 58 (2013)
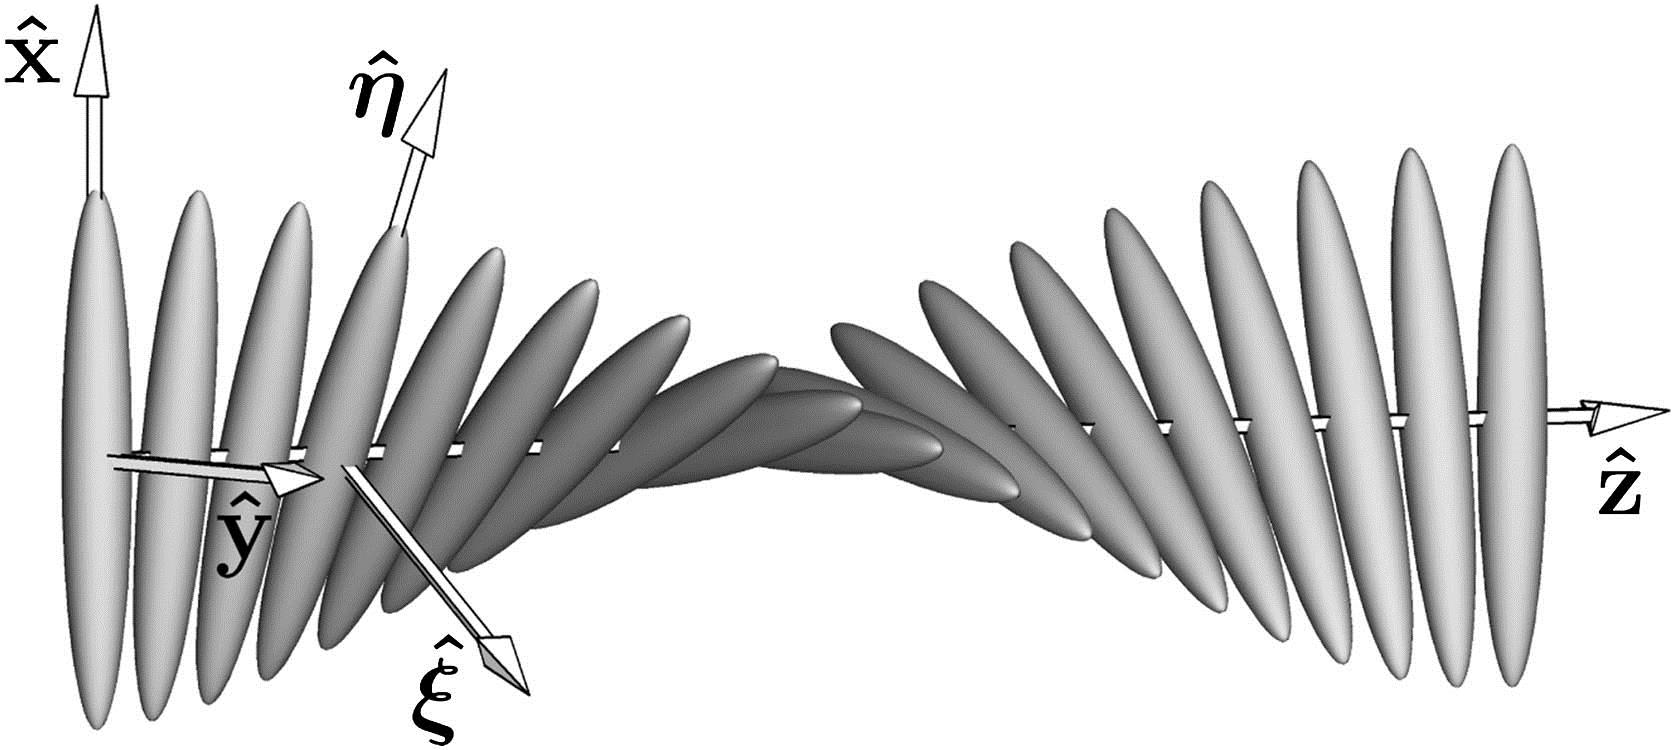
Fig. 1. Schematic representation of the helical structure of the CLC. The orientation of the ellipsoids represents the average orientation of the molecules. The coordinate axes of the lab frame and the rotating frame are shown.
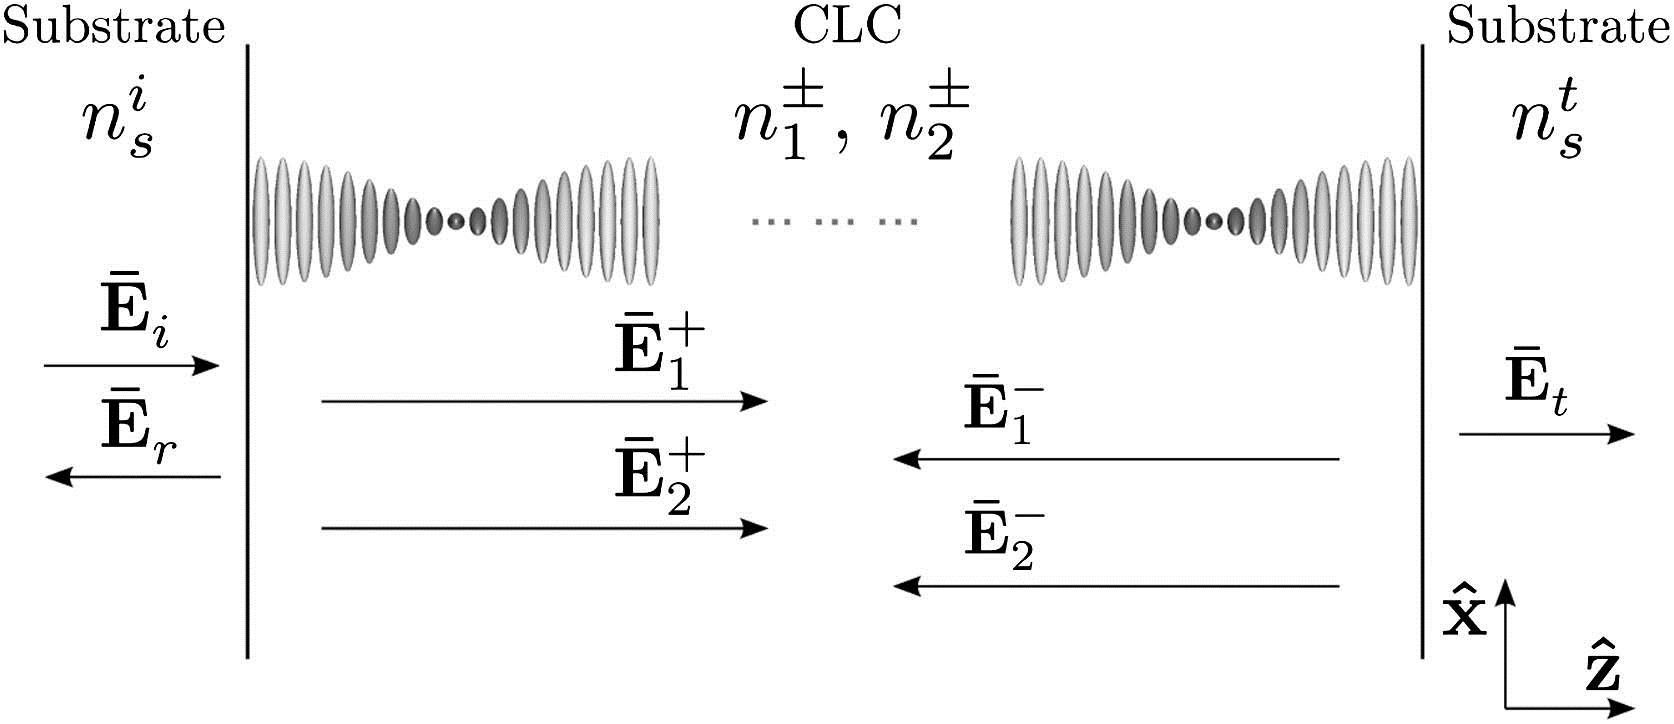
Fig. 2. Schematic representation of a CLC film sandwiched between two substrates, the helical configuration in the lab coordinates systems and the electric fields inside and outside the CLC.
Fig. 3. Reflection and transmission spectra of a CLC slab: (a) numerical inversion of matrix P ¯ ¯ P ¯ ¯ − 1 Q ¯ ¯ P ¯ ¯ − 1
Fig. 4. Reflection and transmission spectra of the CLC slab. Cell thickness to the helical pitch ratio is 10 4
Fig. 5. Reflection spectrum of the CLC slab near the edge of the reflection band. Cell thickness to the helical pitch ratio is 10 4
Fig. 6. Reflection spectrum of the CLC slab at the center of the reflection band. Cell thickness to the helical pitch ratio is 10 4


Set citation alerts for the article
Please enter your email address

© Copyright 2018-2021 | Chinese Laser Press. All Rights Reserved 沪ICP备15018463号-20