• Journal of Geographical Sciences
  • Vol. 30, Issue 11, 1781 (2020)
Lei KANG1、* and Yi LIU1、2
Author Affiliations
  • 1Key Laboratory of Regional Sustainable Development Modeling, Institute of Geographic Sciences and Natural Resources Research, CAS, Beijing 100101, China
  • 2College of Resources and Environment, University of Chinese Academy of Sciences, Beijing 100049, China
  • show less
    DOI: 10.1007/s11442-020-1812-x Cite this Article
    Lei KANG, Yi LIU. Characteristics of industrial structure evolution and isomorphism in Central Asia[J]. Journal of Geographical Sciences, 2020, 30(11): 1781 Copy Citation Text show less
    Location of Central Asian countries
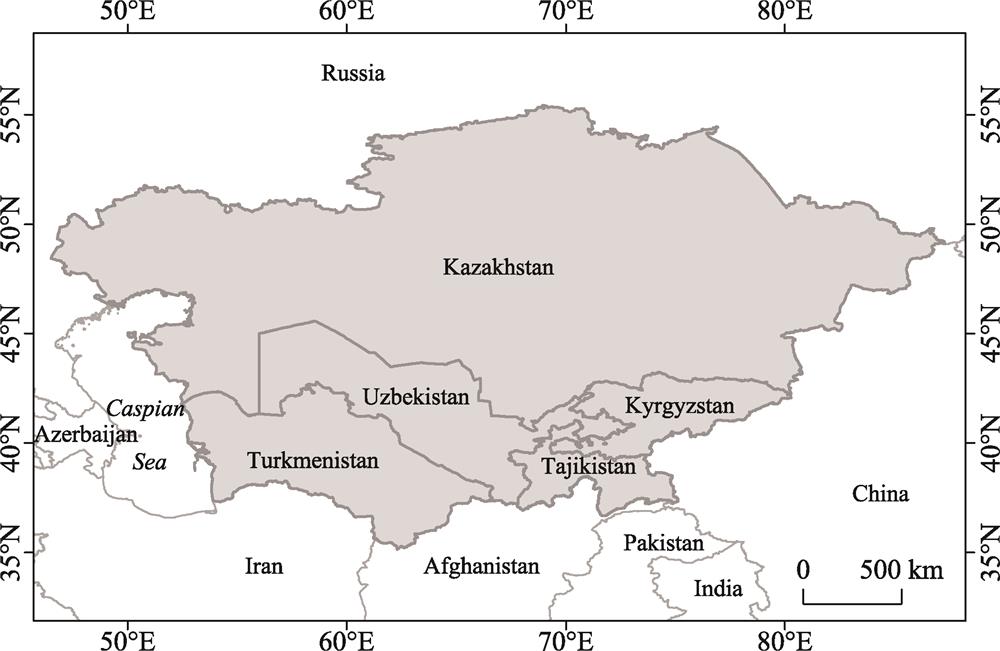
    Fig. 1. Location of Central Asian countries
    Structural trends of evolution of the three industrial sectors in Central Asia from 1990 to 2016
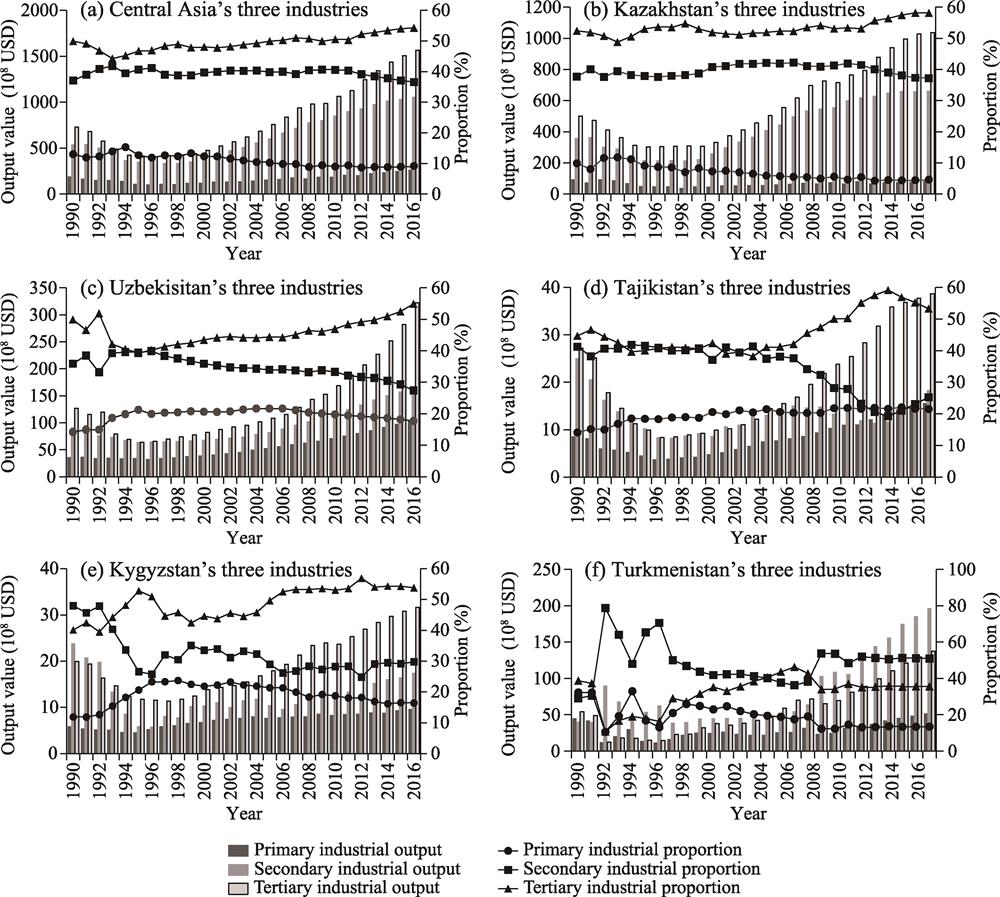
    Fig. 2. Structural trends of evolution of the three industrial sectors in Central Asia from 1990 to 2016
    Comparative advantages of the evolutions of industrial structures in five Central Asian countries
    Fig. 3. Comparative advantages of the evolutions of industrial structures in five Central Asian countries
    Industrial isomorphism among the five Central Asian countries at different industrial levels
    Fig. 4. Industrial isomorphism among the five Central Asian countries at different industrial levels
    CountryYearAgriculture, hunting, forestry, fishingMining, manufacturing, utilitiesManufacturingConstructionWholesale, retail trade, restaurants and hotelsTransport, storage, communication
    Kazakhstan19909.8026.9110.3410.4211.2313.61
    20006.9735.1312.953.8912.8910.22
    20104.5132.9011.327.7013.8611.12
    20164.3527.2510.247.5916.4513.07
    Uzbekistan199017.6037.5831.586.927.3918.43
    200019.3628.7424.114.958.049.09
    201017.9524.2320.286.039.5911.76
    201616.8520.8117.415.2317.0713.59
    Tajikistan199012.5427.8127.818.8915.074.56
    200018.4627.1327.136.1414.883.80
    201019.5914.7414.7410.2320.2411.16
    201619.3512.7112.719.9525.419.12
    Kyrgyzstan199012.2640.1834.839.3911.377.89
    200021.1528.7023.183.7210.884.28
    201017.4520.7416.865.5217.179.07
    201615.3317.8213.709.9821.669.44
    Turkmenistan199032.8925.9025.533.718.9112.12
    200022.9535.0433.016.773.516.63
    201014.0738.9936.757.844.216.43
    201613.1141.3839.008.324.086.24
    Table 1.

    The proportions of outputs of subdivided industries from 1990 to 2016 (%)

    PeriodIndustry typeGjNjPjDj(PD)j
    1990-1999Primary-46.18-4.38-29.26-12.54-41.80
    Secondary-134.86-45.52-77.32-12.02-89.34
    Tertiary-192.06-99.03-99.356.32-93.03
    2000-2009Primary28.903.0221.534.3525.88
    Secondary295.32108.03164.4222.87187.29
    Tertiary383.27170.91184.8327.53212.36
    2010-2016Primary16.152.3824.17-10.4113.77
    Secondary62.4858.1385.33-80.984.36
    Tertiary271.77182.88179.19-90.3188.89
    Table 2.

    Shift-share method analysis of Kazakhstan in different periods from 1990-2016

    PeriodIndustry typeGjNjPjDj(PD)j
    1990-1999Primary1.77-1.68-11.1814.633.45
    Secondary-24.31-11.55-19.616.86-12.76
    Tertiary-49.47-25.13-25.210.87-24.34
    2000-2009Primary27.642.5318.027.1025.12
    Secondary44.2728.1142.78-26.6216.16
    Tertiary70.7742.2945.74-17.2628.48
    2010-2016Primary33.062.5325.694.8430.53
    Secondary41.1711.5616.9812.6329.61
    Tertiary153.7340.2739.4674.00113.46
    Table 3.

    Shift-share method analysis of Uzbekistan in different periods from 1990-2016

    PeriodIndustry typeGjNjPjDj(PD)j
    1990-1999Primary-4.32-0.40-2.66-1.26-3.92
    Secondary-15.83-3.17-5.39-7.26-12.66
    Tertiary-17.97-5.38-5.40-7.18-12.59
    2000-2009Primary5.550.312.213.035.24
    Secondary4.723.585.45-4.301.14
    Tertiary13.905.095.503.318.81
    2010-2016Primary4.560.394.000.174.17
    Secondary4.191.362.000.832.83
    Tertiary13.216.085.961.177.13
    Table 4.

    Shift-share method analysis of Tajikistan in different periods from 1990-2016

    PeriodIndustry typeGjNjPjDj(PD)j
    1990-1999Primary0.69-0.27-1.832.800.97
    Secondary-13.56-3.02-5.13-5.41-10.54
    Tertiary-7.49-3.95-3.960.43-3.53
    2000-2009Primary1.810.443.13-1.761.37
    Secondary1.824.306.55-9.03-2.48
    Tertiary10.137.127.70-4.703.00
    2010-2016Primary1.280.303.03-2.040.98
    Secondary4.901.221.791.903.69
    Tertiary7.985.655.54-3.212.33
    Table 5.

    Shift-share method analysis of Kyrgyzstan in different periods from 1990-2016

    PeriodIndustry typeGjNjPjDj(PD)j
    1990-1999Primary-19.67-2.09-13.95-3.63-17.58
    Secondary4.00-5.13-8.7117.849.13
    Tertiary-21.87-10.70-10.74-0.43-11.17
    2000-2009Primary0.281.6011.39-12.71-1.32
    Secondary64.0218.6128.3317.0845.41
    Tertiary31.7119.5021.09-8.8812.21
    2010-2016Primary20.081.1311.507.4518.95
    Secondary90.8710.2315.0265.6280.64
    Tertiary56.6019.3218.9318.3537.28
    Table 6.

    Shift-share method analysis of Turkmenistan in different periods from 1990-2016

    Lei KANG, Yi LIU. Characteristics of industrial structure evolution and isomorphism in Central Asia[J]. Journal of Geographical Sciences, 2020, 30(11): 1781
    Download Citation