
Lei KANG, Yi LIU. Characteristics of industrial structure evolution and isomorphism in Central Asia[J]. Journal of Geographical Sciences, 2020, 30(11): 1781
- Journal of Geographical Sciences
- Vol. 30, Issue 11, 1781 (2020)
Abstract
Keywords
1 Introduction
The countries of Central Asia became independent following the fall of the Soviet Union in 1991. As the region has since gradually transformed from a planned economy to a market-driven economy, it has opened up to the world, and the rapid development of its energy industry has led to Central Asia becoming an emerging force in the global economy (
A summary of research on the economic development and evolution of the industrial structure in Central Asia has shown that qualitative and anecdotal research based on historical and statistical data is prominent in the literature. Research on the evolution of the industrial structure in Central Asian countries has focused mainly on the temporal evolution of the industrial output and its proportion of the GDP, and reflects the evolution from the perspective of “scale,” which often leads to too broad a set of conclusions that also lack any element of quantification. Few studies have examined problems in the evolution of the industrial structure, and its rationality and competitiveness. Prevalent research has mostly taken a single country as study area, and the lack of comparative research between countries is not conducive to gaining a comprehensive understanding of the overall situation of industrial development in Central Asia and intra-regional differences. It is clear that quantitative and scientific discussion on the characteristics of the industrial structure and its spatio-temporal evolution in Central Asia is lacking, and the available research is not systematic. In addition, the research shows that although Central Asian countries have taken measures to reshape the industrial structure and stimulate economic development since their independence, the pattern of a unitary industrial structure has not fundamentally changed (
This study focuses on the five Central Asian countries as study area. The evolutionary trends and characteristics of their primary, secondary, and tertiary industries as well as key sectors within each are first analyzed. All of the Central Asian region is then used as a reference system, the shift-share method is applied to quantify the rationality and competitiveness of the industrial structure of each country, and dynamic characteristics of the evolution of the industrial structure of each are evaluated. The study also calculates the coefficients of structural similarity at different industrial levels to characterize the isomorphic characteristics and extent of industrial development among Central Asian countries. The aim is to provide a basis for further discussion and interpretation of the relationship between the industrial structure and economic integration in Central Asia.
2 Materials and methods
2.1 Study area
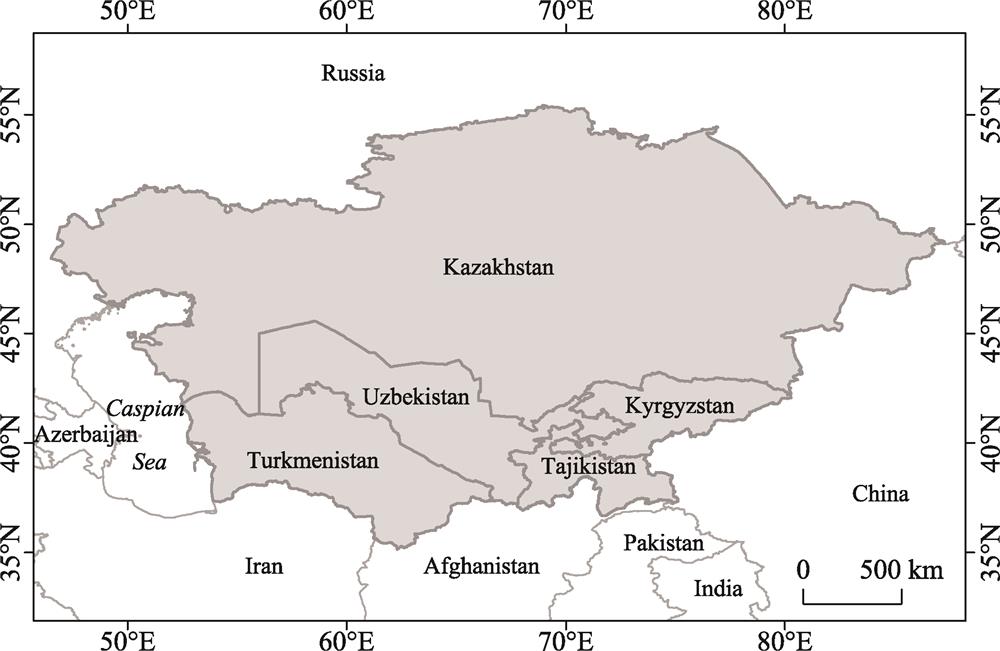
Central Asia is located in the hinterland of Eurasia, lying between 50°-80°E and 35°-55°N, and comprises Kazakhstan, Uzbekistan, Tajikistan, Kyrgyzstan, and Turkmenistan (
![]()
Figure 1.
2.2 Data sources
According to the industry classification of the United Nations Statistics Division, primary industries include agriculture, hunting, forestry, and fishing, secondary industries include mining, manufacturing, utilities, and construction, and tertiary industries include the wholesale and retail trades, restaurants and hotels, transport, storage, communication, and other activities. Based on this classification, this study used GDP output data of the three industrial sectors and key subdivisions of the five Central Asian countries from 1990 to 2016. The industrial output data used were mainly from the United Nations Statistics Division (
2.3 Methods
2.3.1 Shift-share method
The shift-share method is an effective method to analyze structural problems in the economy (
Suppose that after a period [0,
Then, standardize the outputs for all industrial sectors of the region according to their share of the industrial sectors of the larger region as follows:
In this way, the amount of growth
In this study, the regional share component is the redistribution of the GDP of each country based on the industrial structure and growth rate of all of Central Asia. The structural deviation component is a comparison of the three industrial sectors for each country and those for Central Asia. The competitiveness deviation component is a measure of the industrial growth rate of each country and that of Central Asia.
The total growth of the region can be expressed as follows:
$K_{j,0}=b_{j,0}/B_{j,0}$ and $K_{j,t}=b_{j,t}/B_{j,t}$ represent the ratios of growth of industrial sector
In the above,
2.3.2 Similarity coefficient index of industrial structure
Industrial isomorphism has long been a popular subject of research in academic circles. It refers to the phenomenon whereby the evolution of the types of industrial composition, quantity ratios, spatial distributions, and methods of correlation among regions in the process of economic development tends to be consistent, and the structural differences gradually narrow (
where
3 Results
3.1 Evolutionary trends of industrial development in Central Asian countries
3.1.1 Industrial structure of Central Asian countries is becoming more advanced, with an increasingly prominent tertiary-secondary-primary industrial pattern
From the perspective of outputs and their relative portions in the three industrial sectors in Central Asia (
![]()
Figure 2.
3.1.2 Evolutions of the industrial structures of Central Asian countries show different characteristics from the perspective of subdivided industries
To better understand the characteristics of the three industries, this paper analyzes the evolution of major industrial subdivisions in Central Asian countries from 1990 to 2016 based on the outputs of their sub-sectors. The proportions of outputs of the subdivided industries in the five Central Asian countries in different years are shown in
| Country | Year | Agriculture, hunting, forestry, fishing | Mining, manufacturing, utilities | Manufacturing | Construction | Wholesale, retail trade, restaurants and hotels | Transport, storage, communication |
|---|---|---|---|---|---|---|---|
| Kazakhstan | 1990 | 9.80 | 26.91 | 10.34 | 10.42 | 11.23 | 13.61 |
| 2000 | 6.97 | 35.13 | 12.95 | 3.89 | 12.89 | 10.22 | |
| 2010 | 4.51 | 32.90 | 11.32 | 7.70 | 13.86 | 11.12 | |
| 2016 | 4.35 | 27.25 | 10.24 | 7.59 | 16.45 | 13.07 | |
| Uzbekistan | 1990 | 17.60 | 37.58 | 31.58 | 6.92 | 7.39 | 18.43 |
| 2000 | 19.36 | 28.74 | 24.11 | 4.95 | 8.04 | 9.09 | |
| 2010 | 17.95 | 24.23 | 20.28 | 6.03 | 9.59 | 11.76 | |
| 2016 | 16.85 | 20.81 | 17.41 | 5.23 | 17.07 | 13.59 | |
| Tajikistan | 1990 | 12.54 | 27.81 | 27.81 | 8.89 | 15.07 | 4.56 |
| 2000 | 18.46 | 27.13 | 27.13 | 6.14 | 14.88 | 3.80 | |
| 2010 | 19.59 | 14.74 | 14.74 | 10.23 | 20.24 | 11.16 | |
| 2016 | 19.35 | 12.71 | 12.71 | 9.95 | 25.41 | 9.12 | |
| Kyrgyzstan | 1990 | 12.26 | 40.18 | 34.83 | 9.39 | 11.37 | 7.89 |
| 2000 | 21.15 | 28.70 | 23.18 | 3.72 | 10.88 | 4.28 | |
| 2010 | 17.45 | 20.74 | 16.86 | 5.52 | 17.17 | 9.07 | |
| 2016 | 15.33 | 17.82 | 13.70 | 9.98 | 21.66 | 9.44 | |
| Turkmenistan | 1990 | 32.89 | 25.90 | 25.53 | 3.71 | 8.91 | 12.12 |
| 2000 | 22.95 | 35.04 | 33.01 | 6.77 | 3.51 | 6.63 | |
| 2010 | 14.07 | 38.99 | 36.75 | 7.84 | 4.21 | 6.43 | |
| 2016 | 13.11 | 41.38 | 39.00 | 8.32 | 4.08 | 6.24 |
Table 1.
The proportions of outputs of subdivided industries from 1990 to 2016 (%)
(1) Kazakhstan’s service industry has developed rapidly while manufacturing still plays an important role in the national economic system
Although the agricultural output of Kazakhstan, close to 10 billion USD, was relatively high, its proportion of GDP was the lowest among Central Asian countries, decreasing from 9.8% in 1990 to 4.35% of the total in 2016. Its outputs of mining and manufacturing, however, increased, reaching 51.9 billion USD in 2016. The mining sector accounts for more than 15% of the GDP and the manufacturing industry nearly 20%. Kazakhstan’s industry thus makes a significant contribution to the economy. The country is still dominated by the oil and gas industry, metal and non-metal mining industry, and the smelting industry, all of which are influenced by international market conditions. Coking and metallurgical production have developed well. In recent years, the scale of automobile manufacturing has also grown rapidly. The output of the entire manufacturing industry in Kazakhstan increased from 9.962 billion USD to 19.5 billion USD from 1990 to 2016. As the engine of Kazakhstan’s industrialization, the manufacturing industry occupies the core position among the five Central Asian countries. The output of the traditional service industry continues to grow as well. The output of the wholesale and retail sector was 31.329 billion USD in 2016, and that of the transport, storage, and communication sector was 24.886 billion USD, more than twice as much as those in 2000. The ratio of the outputs of the two sectors to the overall economy is now 40%.
(2) Uzbekistan’s industrial structure is diversified and advanced, with potential for industrial development
Uzbekistan’s agricultural output has grown steadily over the years, from 3.607 billion USD in 2000 to 10.402 billion USD in 2016, accounting for more than 16% of the total economy. The output of livestock products, grains, potatoes, and fruits has been increasing in recent years, laying a solid foundation for the development of the national economy and an improvement in the residents’ standards of living. Meanwhile, the tertiary industry has shown vigorous growth. In particular, the output of the wholesale and retail trade has increased from 1.515 billion USD to 10.541 billion USD in the last six years. Correspondingly, its proportion has also increased significantly from less than 8% to 17.07%, emerging as the leading force in the tertiary industry. The output of the transport, storage, and communication sector resumed its growth to 8.393 billion USD in 2016, accounting for 13.07% of the economy, after a period of decline. By comparison, the share of Uzbekistan’s secondary industry has shown a downward trend, but its output has continued to grow steadily from 7.702 billion to 12.846 billion USD. The output of the manufacturing industry, including the oil and gas industry, non-ferrous metal smelting, and heavy machinery manufacturing, reached 10.751 billion USD in 2016 as Uzbekistan’s secondary industrial system is relatively complete. The mining of natural gas, oil, and gold form its pillars, and heavy machinery manufacturing is also relatively developed. However, a lack of high-end manufacturing capacity has affected the secondary industry’s role in stimulating the economy to a greater extent.
(3) Tajikistan has a relatively simple industrial structure, the manufacturing industry is lagging, but the wholesale and retail trade industry has developed
Tajikistan’s agriculture industry has achieved stable growth, and its output increased from 0.857 billion USD in 1990 to 1.561 billion USD in 2016. Whereas the agricultural development of other countries in the region has undergone uncertain changes, Tajikistan’s agricultural output as a proportion of the economy has increased steadily from 12.54% to 19.35%. After independence, the industrial links between Tajikistan and other former Soviet republics were severed, which had a significant impact on the local industry, and the proportion of output of the secondary industrial declined year by year. Tajikistan’s industrial sectors include the mining of aluminum and hydropower generation. It is the largest primary producer of aluminum in Central Asia. Due to the impact of rising domestic industrial costs and falling international aluminum prices, a decline in aluminum production has directly led to a drop in its proportion of the secondary industrial output from 27.13% of 2000 to 12.71% of 2016. The share of construction has risen steadily since 2000, and is mainly related to local infrastructure construction. The growth of the tertiary industry is more prominent, especially the wholesale and retail trade sector, with its output and proportion of the economy increasing from 1.029 billion USD, 15.07%, to 2.05 billion USD, 25.41%, from 1990 to 2016. As its import and export trade has played an increasingly significant role in driving economic growth, the wholesale and retail trade industry has developed.
(4) Kyrgyzstan’s industrial development situation is grim, internal sectors have develop unevenly, but the service industry has grown steadily
Kyrgyzstan is a country reliant on traditional farming and animal husbandry. Its agricultural output has grown from 0.59 billion USD in 1990 to 0.965 billion USD in 2016, but the industry’s proportion of the GDP has shown a downward tendency. In recent years, Kyrgyzstan has developed the construction industry, the output and proportion of the economy of which have grown to nearly 10%. Manufacturing in Kyrgyzstan accounts for more than 50% of total industrial output, with the power industry and machinery manufacturing being important sectors. Large fluctuations in the output of gold mines have severely constrained industrial growth. Affected by the reduced mining of gold in the Kumtor Mine as well as reductions in power and oil production, mining as a pillar of Kyrgyzstan’s economy has weakened. The country’s total industrial output fell from 1.934 billion USD in 2000 to 1.122 billion USD in 2016, and its proportion of the GDP dropped significantly from 40.18% to 17.82%. Overall, industrial development is facing severe shrinkage. The growth of the service industry is stable but other sectors are unevenly developed. The wholesale and retail trade industry has grown rapidly, accounting for 21.66% of the GDP in 2016, significantly higher than that of the transport, storage, and communication sector.
(5) Turkmenistan’s agriculture and service industries are lagging behind, the oil and gas industry accounts for a large proportion of the economy, but the industrial structure is not advanced and diversified enough
Turkmenistan’s agricultural output is low, and its proportion of the GDP dropped from 32.89% in 1990 to 13.11% in 2016. The total industrial output, including mining and manufacturing, has grown rapidly, an increase from 3.542 billion USD to 16.37 billion USD, and its proportion of the GDP has also increased significantly from 25.9% to 41.38%. Natural gas, and oil extraction and processing are the pillars of the economy. The power and textile industries have also developed rapidly, but that of the construction industry has been slow, with a low output. The output of the service industry is also low, and its proportion of the economy has been declining in recent years. The service industry is also underdeveloped.
3.2 Dynamic evolution of industrial structure based on shift-share analysis
Based on previous studies (
The results of the shift-share of Kazakhstan are shown in
| Period | Industry type | ( | ||||
|---|---|---|---|---|---|---|
| 1990-1999 | Primary | -46.18 | -4.38 | -29.26 | -12.54 | -41.80 |
| Secondary | -134.86 | -45.52 | -77.32 | -12.02 | -89.34 | |
| Tertiary | -192.06 | -99.03 | -99.35 | 6.32 | -93.03 | |
| 2000-2009 | Primary | 28.90 | 3.02 | 21.53 | 4.35 | 25.88 |
| Secondary | 295.32 | 108.03 | 164.42 | 22.87 | 187.29 | |
| Tertiary | 383.27 | 170.91 | 184.83 | 27.53 | 212.36 | |
| 2010-2016 | Primary | 16.15 | 2.38 | 24.17 | -10.41 | 13.77 |
| Secondary | 62.48 | 58.13 | 85.33 | -80.98 | 4.36 | |
| Tertiary | 271.77 | 182.88 | 179.19 | -90.31 | 88.89 |
Table 2.
Shift-share method analysis of Kazakhstan in different periods from 1990-2016
The results of the shift-share analysis of Uzbekistan are shown in
| Period | Industry type | ( | ||||
|---|---|---|---|---|---|---|
| 1990-1999 | Primary | 1.77 | -1.68 | -11.18 | 14.63 | 3.45 |
| Secondary | -24.31 | -11.55 | -19.61 | 6.86 | -12.76 | |
| Tertiary | -49.47 | -25.13 | -25.21 | 0.87 | -24.34 | |
| 2000-2009 | Primary | 27.64 | 2.53 | 18.02 | 7.10 | 25.12 |
| Secondary | 44.27 | 28.11 | 42.78 | -26.62 | 16.16 | |
| Tertiary | 70.77 | 42.29 | 45.74 | -17.26 | 28.48 | |
| 2010-2016 | Primary | 33.06 | 2.53 | 25.69 | 4.84 | 30.53 |
| Secondary | 41.17 | 11.56 | 16.98 | 12.63 | 29.61 | |
| Tertiary | 153.73 | 40.27 | 39.46 | 74.00 | 113.46 |
Table 3.
Shift-share method analysis of Uzbekistan in different periods from 1990-2016
The results of the shift-share analysis of Tajikistan are shown in
| Period | Industry type | ( | ||||
|---|---|---|---|---|---|---|
| 1990-1999 | Primary | -4.32 | -0.40 | -2.66 | -1.26 | -3.92 |
| Secondary | -15.83 | -3.17 | -5.39 | -7.26 | -12.66 | |
| Tertiary | -17.97 | -5.38 | -5.40 | -7.18 | -12.59 | |
| 2000-2009 | Primary | 5.55 | 0.31 | 2.21 | 3.03 | 5.24 |
| Secondary | 4.72 | 3.58 | 5.45 | -4.30 | 1.14 | |
| Tertiary | 13.90 | 5.09 | 5.50 | 3.31 | 8.81 | |
| 2010-2016 | Primary | 4.56 | 0.39 | 4.00 | 0.17 | 4.17 |
| Secondary | 4.19 | 1.36 | 2.00 | 0.83 | 2.83 | |
| Tertiary | 13.21 | 6.08 | 5.96 | 1.17 | 7.13 |
Table 4.
Shift-share method analysis of Tajikistan in different periods from 1990-2016
The results of the shift-share analysis of Kyrgyzstan are shown in
| Period | Industry type | ( | ||||
|---|---|---|---|---|---|---|
| 1990-1999 | Primary | 0.69 | -0.27 | -1.83 | 2.80 | 0.97 |
| Secondary | -13.56 | -3.02 | -5.13 | -5.41 | -10.54 | |
| Tertiary | -7.49 | -3.95 | -3.96 | 0.43 | -3.53 | |
| 2000-2009 | Primary | 1.81 | 0.44 | 3.13 | -1.76 | 1.37 |
| Secondary | 1.82 | 4.30 | 6.55 | -9.03 | -2.48 | |
| Tertiary | 10.13 | 7.12 | 7.70 | -4.70 | 3.00 | |
| 2010-2016 | Primary | 1.28 | 0.30 | 3.03 | -2.04 | 0.98 |
| Secondary | 4.90 | 1.22 | 1.79 | 1.90 | 3.69 | |
| Tertiary | 7.98 | 5.65 | 5.54 | -3.21 | 2.33 |
Table 5.
Shift-share method analysis of Kyrgyzstan in different periods from 1990-2016
The results of the shift-share analysis of Turkmenistan are shown in
| Period | Industry type | ( | ||||
|---|---|---|---|---|---|---|
| 1990-1999 | Primary | -19.67 | -2.09 | -13.95 | -3.63 | -17.58 |
| Secondary | 4.00 | -5.13 | -8.71 | 17.84 | 9.13 | |
| Tertiary | -21.87 | -10.70 | -10.74 | -0.43 | -11.17 | |
| 2000-2009 | Primary | 0.28 | 1.60 | 11.39 | -12.71 | -1.32 |
| Secondary | 64.02 | 18.61 | 28.33 | 17.08 | 45.41 | |
| Tertiary | 31.71 | 19.50 | 21.09 | -8.88 | 12.21 | |
| 2010-2016 | Primary | 20.08 | 1.13 | 11.50 | 7.45 | 18.95 |
| Secondary | 90.87 | 10.23 | 15.02 | 65.62 | 80.64 | |
| Tertiary | 56.60 | 19.32 | 18.93 | 18.35 | 37.28 |
Table 6.
Shift-share method analysis of Turkmenistan in different periods from 1990-2016
![]()
Figure 3.
The structural effect index of Kazakhstan has always been greater than one but its regional competition effect index was only greater than one in the second period, and decreased to 0.91 from 2010 to 2016, confirming a downward trend in industrial competitiveness. Moreover, the decline in competitiveness led to a relative growth rate of less than one, making Kazakhstan a country with structural advantages but lagging behind in terms of competitiveness. The relative growth rate of Uzbekistan has reached 1.19 in recent years. Both its structural effect index and the regional competition effect index have decreased and then increased. Combined with the above analysis, it is clear that these changes were caused mainly by changes in the competitiveness of its secondary and tertiary industries, and where the country was driven by both structural and competitive advantages. The regional competition effect index of Tajikistan was greater than one only in 2000-2009, and so the competitive advantage is not clear. The structural effect index, however, was greater than one in all periods, and the relative growth rate has been greater than one since 2000; thus, Tajikistan can be classed as a country driven by structural advantage.
The relative growth rate of Kyrgyzstan has been less than one for many years. Although its industrial structure is feasible, its regional competition effect index has been less than one for a long time, making Kyrgyzstan relatively uncompetitive and lagging behind the other four countries in the region.
The relative growth rate of Turkmenistan reached 1.29 during 2010-2016, with a higher economic growth rate than that of Central Asia. Although the structural effect index has been less than one in recent years, with a certain degree of irrationality to the industrial structure, the regional competition effect index has increased significantly. Thus, Turkmenistan is considered a competitively advantaged country.
3.3 Analysis of industrial isomorphism in Central Asia
The process of changes in the industrial structural in Central Asia not only presents the different characteristics of countries, but also features common to them. We can obtain the industrial isomorphism in Central Asian countries by measuring the average level of the similarity coefficient of industrial structure over the years 1990-2016 (
![]()
Figure 4.
The structural similarity coefficients of the three industries for countries were over 0.9, and those for Turkmenistan were above 0.95. The coefficients for similarities between Uzbekistan and Kyrgyzstan, and Tajikistan and Kyrgyzstan were over 0.98, and that between Uzbekistan and Tajikistan was the highest, 0.9936. The coefficients for similarities between Kazakhstan and Uzbekistan, and Tajikistan, and Kyrgyzstan were 0.96-0.98, while those between Turkmenistan and the other four countries were relatively low, just over 0.85. The problem of isomorphism at the three industrial levels among the five Central Asian countries is critical, mainly due to the limitation of resources and low economic development (
However, it is not sufficient to identify the industrial isomorphism at a broad level for the three industries in Central Asia. To gain a more comprehensive understanding of the similarity in industrial structure among them, similarities among the industrial subdivisions should also be calculated and analyzed. Based on the above analysis, it can be concluded that the foundation of the secondary industry is solid, and all countries except Turkmenistan have formed an industrial structure dominated by the tertiary industry. We thus calculate the structural similarity coefficients of the secondary and tertiary subindustries.
The similarity coefficient of the secondary industrial subdivisions highlights the problem of industrial isomorphism, but the degree of structural similarity has declined in relation to the three industrial levels. The structural similarity coefficient varied among countries. It exceeded 0.9 for the similarities between Kazakhstan and Kyrgyzstan, Uzbekistan and Kyrgyzstan, Uzbekistan and Turkmenistan, and Kyrgyzstan and Turkmenistan, but was below 0.85 for the other countries, with the lowest value of 0.5592 for the similarity between Kazakhstan and Turkmenistan. The structural similarity coefficients of Kazakhstan and Uzbekistan, Kazakhstan and Kyrgyzstan, and Tajikistan and Turkmenistan were all in the range 0.6-0.8, while those of Uzbekistan and Tajikistan, and Uzbekistan and Kyrgyzstan were in the range 0.8-0.85. The isomorphism of the internal secondary industry in Central Asia has thus decreased. On the contrary, affected by the “division of labor” policy of the Soviet Union, the developmental priorities of the countries were not alike. For instance, reliant on the metallurgical and chemical industries, Kazakhstan has mainly expanded heavy industry, while Tajikistan has focused on manufacturing, the non-ferrous metal industry, and the chemical industry. But in Uzbekistan, a relatively complete industrial system has been established, with particular stress on raw material production. Each country has developed some advantages in the secondary industry (
The results show that although the similarity coefficients of the tertiary industrial subdivisions were lower than those for the three industries, they were significantly higher than that for the secondary industry. No isomorphism was evident in the tertiary industrial subdivisions of Tajikistan and Turkmenistan, and their similarity coefficient was only 0.8085. But other countries exhibited isomorphism, with structural similarity coefficients between 0.89 and 0.99, of which the coefficients of Kazakhstan and Uzbekistan, and Kazakhstan and Kyrgyzstan were the highest, exceeding 0.98. To promote economic growth, and broaden domestic production and consumption, Central Asian countries have attached increasing importance to the tertiary industry. The commerce and retail industry, telecommunication industry, and tourism industry are closely related to people’s livelihood, require a large amount of labor, and thus form the main content of the tertiary industry in Central Asia. By focusing on the development of these industries, the countries have expanded domestic production and consumption, and boosted their economic growth. However, the diversification of the tertiary industry in Central Asia remains limited (
(a) Isomorphism among three industries; (b) Isomorphism among secondary industrial subdivisions; (c) Isomorphism among tertiary industrial subdivisions
4 Discussion
4.1 Characteristics of evolution and interpretation of the industrial structure of the five Central Asian countries
The history of economic development shows that the industrial structure of any region undergoes an evolution from unreasonable to reasonable, and from having a low to a high output (
4.2 Understanding the industrial isomorphism in Central Asia
A certain degree of similarity was noted in the industrial structures of the Central Asian countries. The problem of industrial isomorphism occurred at different industrial levels. A few countries recorded relatively low similarity in the secondary subindustries. Considering the conditions in Central Asia, the high degree of industrial similarity is inevitable. First, the region is rich in energy and mineral resources, which determines the similarity of the countries’ leading industries. Moreover, Central Asian countries are characterized by similar directions of industrial development as they are abundant in light and heat, grains, cotton, fruit, flowers, and livestock. This gives them a prominent advantage in agriculture. Second, influenced by the economic division of labor in the Soviet Union, mineral extraction and primary processing, and agriculture were the leading industries in Central Asian countries for a long time (
4.3 Cooperation between China and Central Asian countries
Easing the burden on its traditional industries is an important goal for China. The Chinese government needs to explore ways of motivating economic cooperation and foreign investment to cope with the slowdown in its economic growth. The Belt and Road Initiative has provided an opportunity for China and partner countries to develop the capacity for cooperation. As an important part of the Belt and Road region (
4.4 Limitations
This paper introduced classic methods of industrial structural analysis and the relevant indicators to quantitatively examine the characteristics of the industrial structure and its spatio-temporal evolution in Central Asia from a diversity of perspectives. We first described the scale and structural characteristics of the industrial evolution of Central Asian countries. Based on the shift-share analysis method, a comparative analysis of the rationality and industrial competitiveness of these structures was conducted from three perspectives under the premise of placing the five Central Asian countries in the same reference system. Finally, the industrial isomorphic coefficient was introduced to examine the problem of industrial homogeneity among the countries. Using the quantitative results, we corroborated the history of the industrial development and its current situation in each country.
However, this study pays too much attention to the diversification of research perspectives and ignores the innovation in research methods. In future research, it is necessary to expand the research horizon and select more diverse methods to carry out industrial economic research. Data on the industries and subindustries of Central Asian countries used in this article were taken from the United Nations statistical database. This is the most complete data on industry in Central Asia according to subdivision. In future work, it is important to collect more detailed industrial data, such as those related to the scale of production. In addition, we can quantitatively research differences and complementarities in industry among the five Central Asian countries and China to provide support for the path of cooperation between them.
5 Conclusions
By taking Central Asia as research area, the evolutionary characteristics of the three regional industrial sectors and key subdivisions were examined in this study. The shift-share method was used to analyze the dynamic characteristics of the industrial sectors of each country from the standpoints of rationality and competitiveness. The contribution of the main industrial sectors to economic growth and their evolution were examined quantitatively by using the grey correlation method. The results showed the following: (1) The industrial structures in Central Asia have become more advanced and rational while their evolutionary characteristics are different. Kazakhstan has long displayed a tertiary-secondary-primary pattern of industrial activity, and productive services have played an increasingly prominent role in the development of the tertiary industry. The transformation of Uzbekistan’s industrial structure has been apparent; the country had a secondary-tertiary-primary pattern upon independence and now has a tertiary-secondary-primary pattern. Tajikistan’s industrial structure has changed significantly. In recent years, the secondary sector has been shrinking and the tertiary sector has developed rapidly. In Kyrgyzstan, the proportion of secondary and tertiary industries has been fluctuating significantly, but considerable progress has been made in the service sector. The industrial structure of Turkmenistan is significantly poorer than those of the other countries. It is the only country in the Central Asian region that still retains a secondary-tertiary-primary industrial pattern. (2) The rational and competitiveness of the industrial structures of the five countries displayed differing characteristics. Since 2000, the structural effect index of Kazakhstan has been greater than one but its regional competition effect index has dropped to 0.91, reflective of a country with structural advantages but lagging in competitiveness. The structural effect index and the regional competitiveness effect index of Uzbekistan have increased to 1.01 and 1.18, respectively, in recent years. It is thus driven by both structural and competitive advantages. Tajikistan, with a structural effect index greater than one at each stage, is a typical country driven by structural advantage. The regional competition effect indices of Kyrgyzstan in the three stages of 1990-1999, 2000-2009, and 2010-2016 were 0.91, 0.75, and 0.94 respectively. It is a typical country with low competitiveness. Turkmenistan’s regional competitiveness index was 1.34, effectively driving up the relative growth rate and rendering it a typical country with competitive advantages. (3) The results of the degrees of industrial isomorphism in Central Asia show that the similarity coefficients of the three industrial structures between countries were higher than 0.95, and those of the secondary subindustries in some countries were below 0.85. The similarity coefficients of the tertiary subindustries for most countries were above 0.89. That means that there was a considerable degree of similarity in the industrial structure among the Central Asian countries.
References
[1] BiY R, ShiB. Measurement and analysis of trade potential between China and five Central Asian countries: Study of trade complementarity index and gravity model. Asia-Pacific Economic Review, 47-51(2010).
[2] ChangQ. Discussion on economic system and development model of five Central Asian countries. Social Sciences in Xinjiang, 65-71(2001).
[3] DingZ G, PanX Y. Evaluation and proposals of investment climate in Central Asian countries against the background of the Silk Road Economic Belt. Russian Central Asian & East European Market, 53-72(2017).
[4] DuarteP. Central Asia: The planet’s pivot area. Revista Española de Relaciones Internacionales, 159-206(2014).
[5] GangC C, RenB P. The development mode of the five Central Asian countries on the background of the Silk Road Economic Belt. Reform, 109-118(2015).
[6] GaoZ G. An analysis of status quo and slow development of regional economic cooperation among Central Asian countries. Journal of Xinjiang University of Finance and Economics, 12-18(2013).
[7] HuH P. Analysis of economic situation of Central Asian countries. Russian Central Asian & East European Market, 20-26(2004).
[8] HuangQ. Analysis of the problems of the three major industries in Tajikistan. Northern Economy and Trade, 9-10(2017).
[9] KundsenD C. Shift-share analysis: Further examination of models for the description of economic change. Socio-Economic Planning Sciences, 34, 177-198(2000).
[10] LiL Q, KongX, LiY M et al. The selection of the strategic pivot in China-Central Asia cooperation under the Belt and Road Initiative. Geographical Research, 38, 1705-1719(2019).
[11] LuQ, ZhangC Y. An evidential analysis of the relation between the evolution of industrial structure and economic growth in Henan. China Population, Resources and Environment, 18, 111-115(2008).
[12] MegoranN, SharapovaS. MacKinder’s “heartland”: A help or hindrance in understanding Central Asia’s international relations?. Central Asia and the Caucasus, 34, 8-20(2005).
[13] RenQ L, IvanS. A comparative study of industrial international competitiveness between Xinjiang, China and Kazakhstan. Finance & Economics of Xinjiang, 67-74(2015).
[14] ShiT G, ZhangX L, DuH R et al. Manufacturing spatial distribution and structural characteristics in Central Asia. Arid Land Geography, 36, 749-756(2013).
[15] SunL, FuL, ShenA B. Analysis of industrial structure evolution in Kazakhstan. Social Sciences in Xinjiang, 76-81(2012).
[16] SunL, WuH W. Annual Report on Development of Central Asia(2017)(2017).
[17] TangH, ChenD B. Development features and temporal-spatial evolution of economy in Central Asia in the past 20 years. Journal of University of Chinese Academy of Sciences, 32, 214-220(2015).
[18] TangH, YangD G, ChenD B et al. Development of energy industry and its impact on regional economy in the Central Asia. Arid Land Geography, 37, 630-637(2014).
[19] The Belt and Road Initiative and the future of Central Asian economic integration. Modern Economic Information, 154-155,157.
[20] World Industry Since 1960: Progress and Prospects. New York:. United Nations(1979).
[21] WangH Y. Complementary analysis of economic cooperation between the five Central Asian countries and Xinjiang, China. East European, Russian & Central Asian Market Studies, 10-16(2002).
[22] WangH Y. Economic reforms and effects in five Central Asian countries. Russian Central Asian & East European Market, 12-18(2004).
[23] WangS J, ZhangM J, ChenF L et al. Comparison of GCM-simulated isotopic compositions of precipitation in arid Central Asia. Journal of Geographical Sciences, 25, 771-783(2015).
[24] WangY F, HuaY T. The authentic research on the industry structure convergence in the Bohai Rim Region. Economy and Management, 22, 30-33(2008).
[25] WeiM L. Study on industrial development and structural complementarity between Shaanxi province and five Central Asian countries. Journal of Shaanxi University of Technology (Social Sciences), 33, 64-70(2015).
[26] WenY N. Comparison of industrial structure between Xinjiang, China and five Central Asian countries. Russian & Central Asian Market Studies, 25-33(2011).
[27] XianG Z, TianC Y. Analysis of economic development in five Central Asian countries. China Business Update, 31-36(2017).
[28] YangJ H. Analysis of advantages and development status of characteristic industries in Uzbekistan. Economic Vision, 68-70(2012).
[29] YangY, LiuY, JinF J. Study on energy cooperation between China and the Central Asia and Russia under the view of energy geopolitics. Geographical Research, 34, 213-224(2015).
[30] ZhangJ Y, ChenY I, LiZ. Assessment of efficiency and potentiality of agricultural resources in Central Asia. Journal of Geographical Sciences, 28, 1329-1340(2018).
[31] ZhengG F. Analysis on the system transition and economic development in Turkmenistan. Journal of Hexi University, 67-72(2009).
[32] ZhuX M, XuS B. A review of Chinese regional convergence of industrial structure research. Human Geography, 22, 20-22, 86(2007).


Set citation alerts for the article
Please enter your email address

© Copyright 2018-2021 | Chinese Laser Press. All Rights Reserved 沪ICP备15018463号-20