
Chenggang Dai, Mingxing Lin, Zhen Wang, Dong Zhang, Zhiguang Guan. Color Compensation Based on Bright Channel and Fusion for Underwater Image Enhancement[J]. Acta Optica Sinica, 2018, 38(11): 1110003
- Acta Optica Sinica
- Vol. 38, Issue 11, 1110003 (2018)
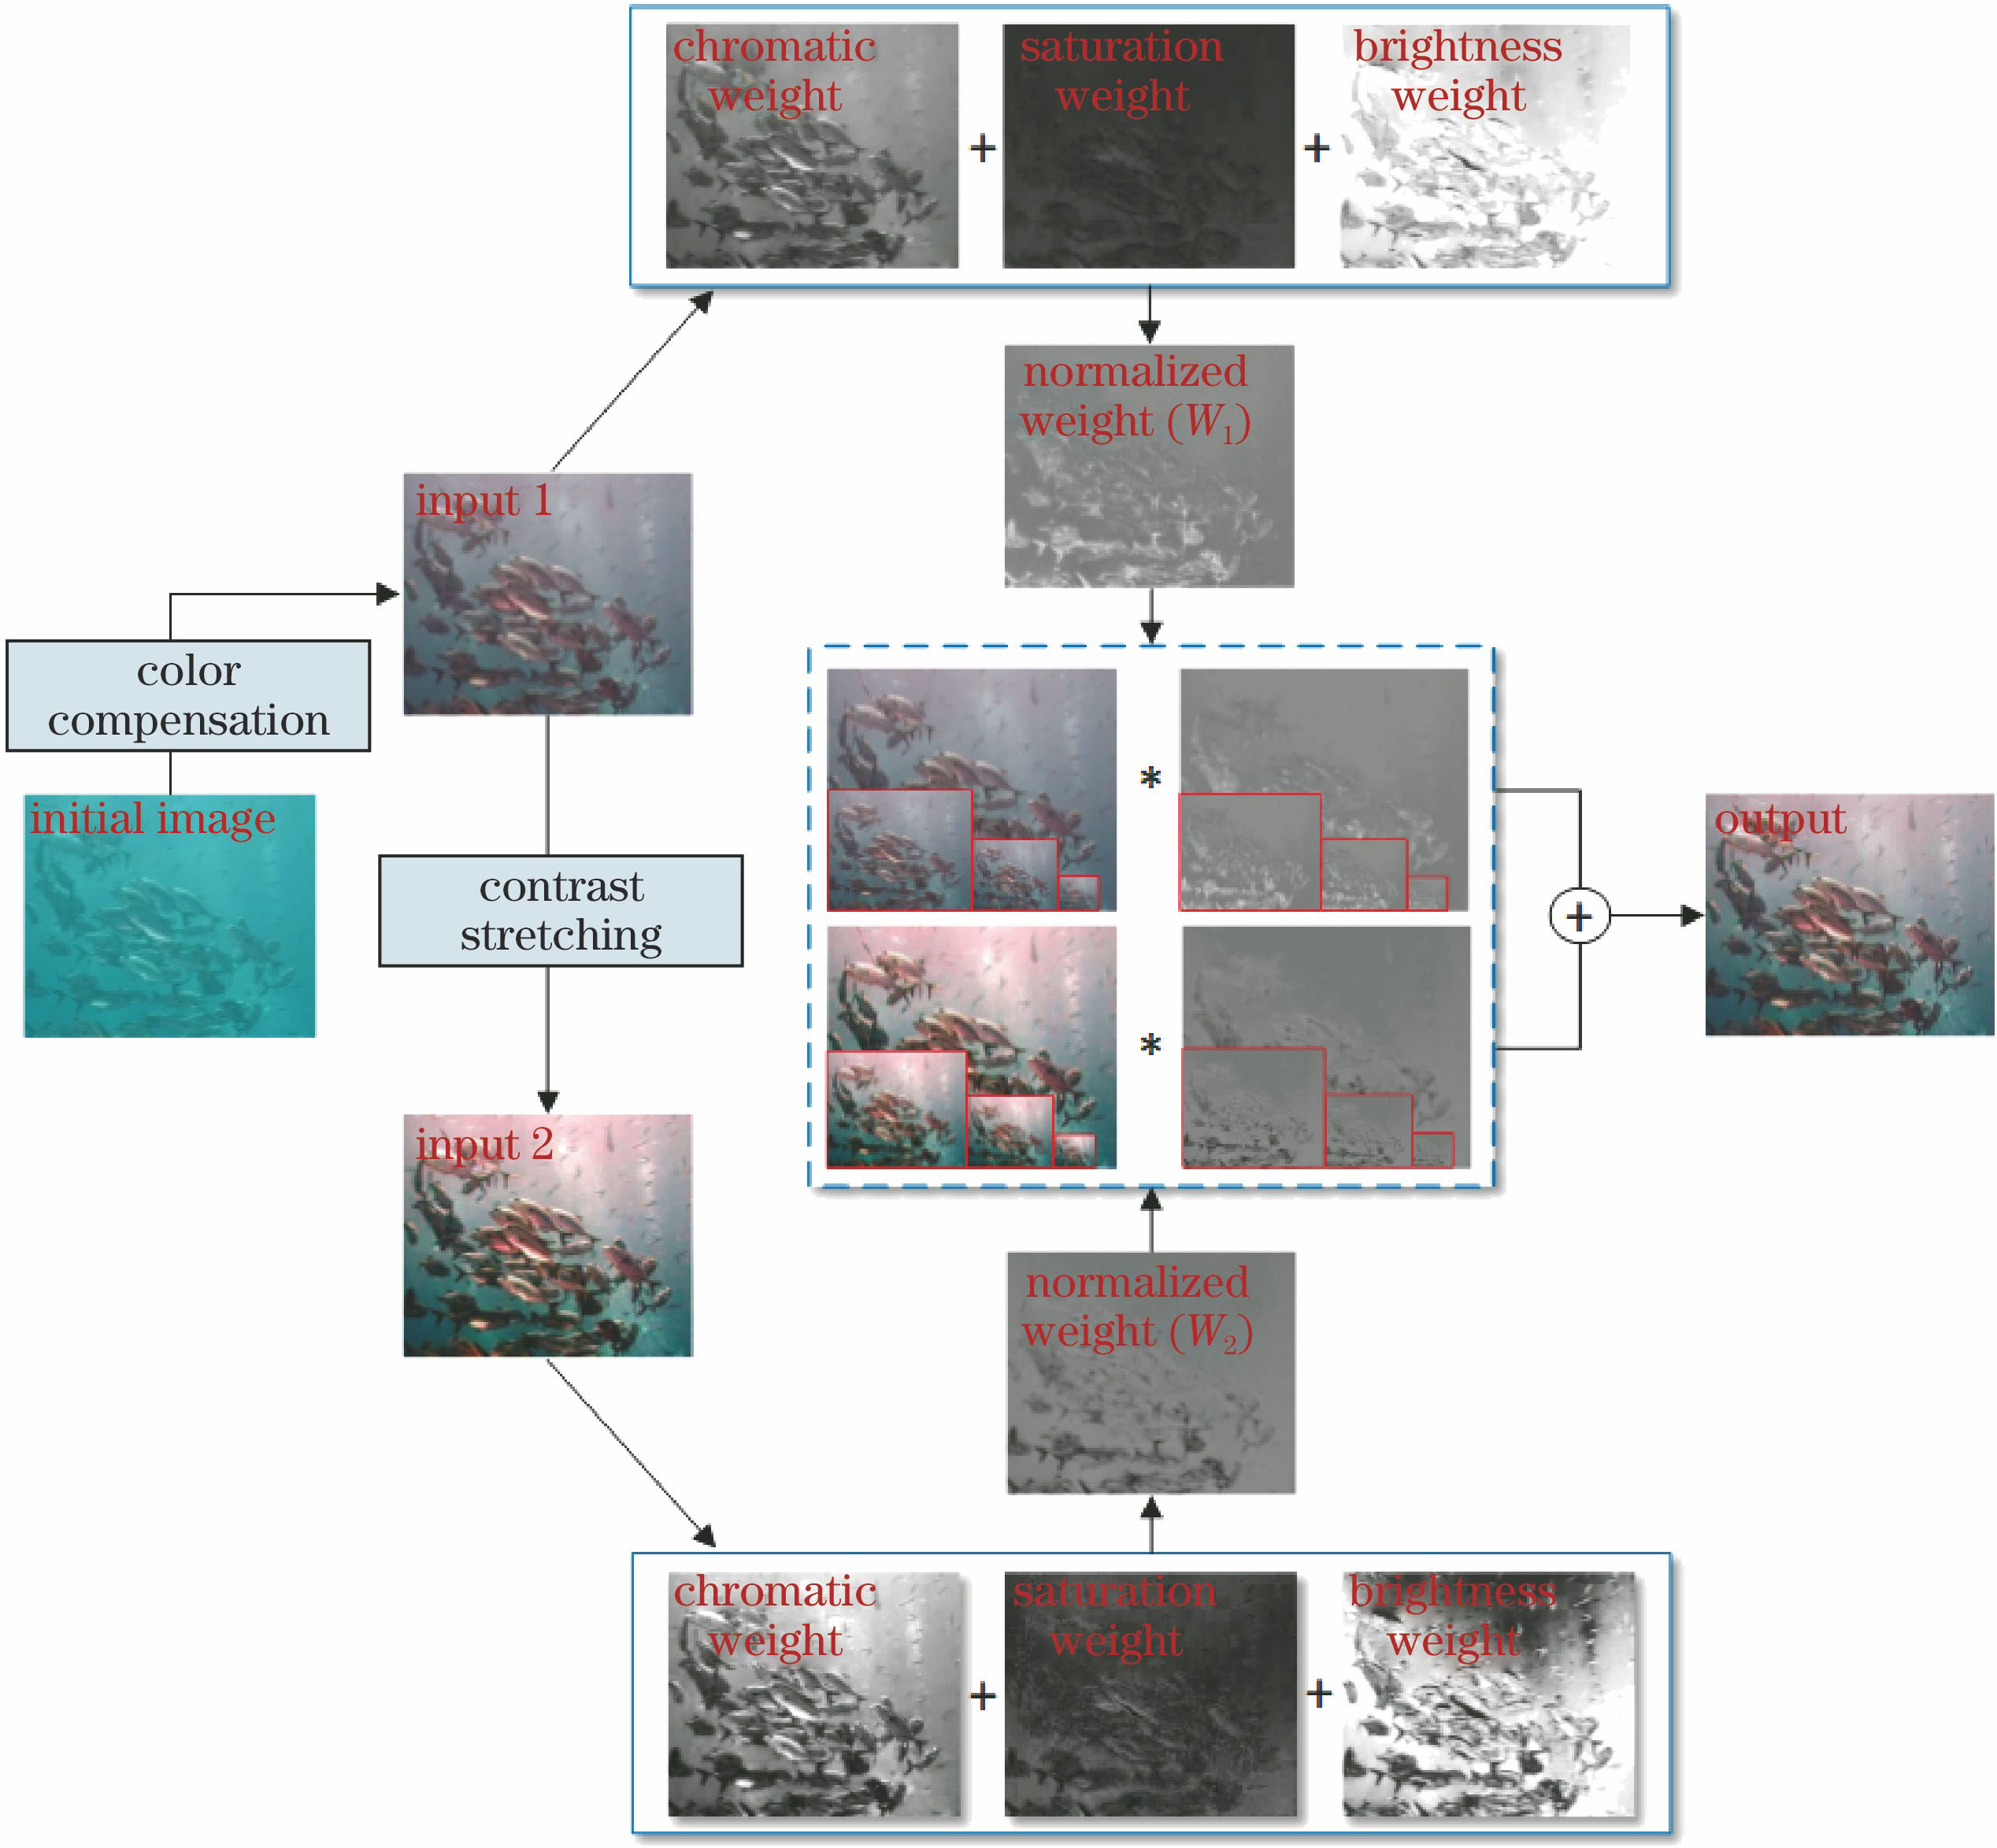
Fig. 1. Flow chart of the proposed method
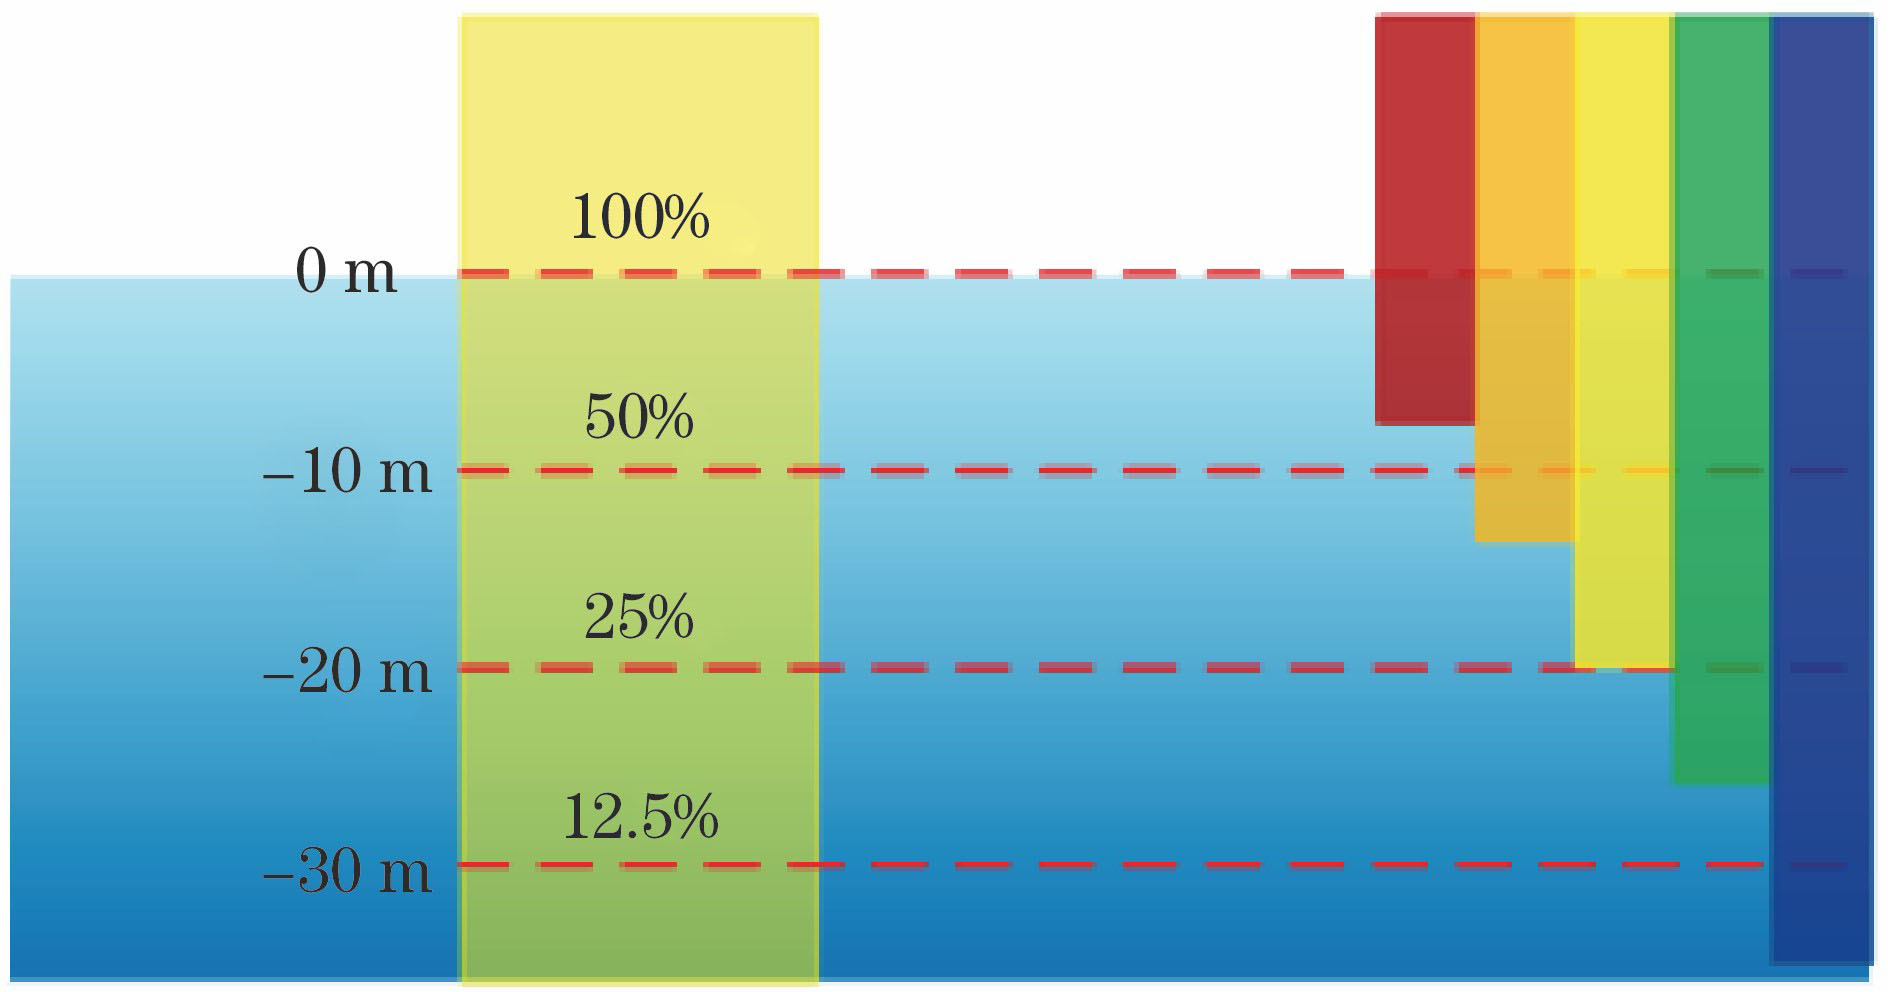
Fig. 2. Schematic of underwater light absorption
Fig. 3. Contrast color-compensated image and original image. (a) Original image; (b) red channel; (c) green channel; (d) blue channel; (e) color compensated image based on bright channel; (f) color compensated red channel; (g) color compensated green channel; (h) color compensated blue channel
Fig. 4. Schematic of underwater optical imaging
Fig. 5. Adaptive contrast-stretched image. (a) Original image; (b) contrast-stretched image
Fig. 6. Weight maps. (a) Color-compensated image (input1); (b) normalized weight maps for input1; (c) contrast-stretched image (input2); (d) normalized weight maps for input2
Fig. 7. Color recovery test. (a) Standard color checker; (b) original image; (c) CALHE method; (d) DCP method; (e) MSRCR method; (f) proposed method
Fig. 8. Color distortion image test. (a) Original image; (b) CALHE method; (c) DCP method; (d) MSRCR method; (e) proposed method
Fig. 9. Hazed image test. (a) Group of original images; (b) CALHE method; (c) DCP method; (d) MSRCR method; (e) proposed method
Fig. 10. Application test. (a) Feature point matching in the original image; (b) feature point matching in image processed using the proposed method
| |||||||||||||||||||||||||||||||||||||||||||||||||||||||||||||||||||||||||||||||||||||||||||||||||||||||||||
Table 1. Quality evaluation of underwater images
|
Table 2. Number of feature points matching contrast in original images and images processed using our method

Set citation alerts for the article
Please enter your email address
© Copyright 2018-2021 | Chinese Laser Press. All Rights Reserved 沪ICP备15018463号-20