• Photonics Research
  • Vol. 2, Issue 4, B31 (2014)
Fangjian Xing1、2, Hongwei Chen1、2、*, Cheng Lei1、2, Zhiliang Weng1、2, Minghua Chen1、2, Sigang Yang1、2, and and Shizhong Xie1、2
Author Affiliations
  • 1Tsinghua National Laboratory for Information Science and Technology (TNList), Beijing 100084, China
  • 2Department of Electronic Engineering, Tsinghua University, Beijing 100084, China
  • show less
    DOI: 10.1364/PRJ.2.000B31 Cite this Article Set citation alerts
    Fangjian Xing, Hongwei Chen, Cheng Lei, Zhiliang Weng, Minghua Chen, Sigang Yang, and Shizhong Xie. Serial wavelength division 1 GHz line-scan microscopic imaging[J]. Photonics Research, 2014, 2(4): B31 Copy Citation Text show less
    Experimental setup of the superfast serial wavelength-division line scan imaging system with 1 GHz. AM, amplitude modulator; EDFA, erbium-doped fiber amplifier; BS, beam splitter; PD, photodetector. Inset shows the temporal profile and spectrum of the amplitude-modulated 1 GHz pulse.
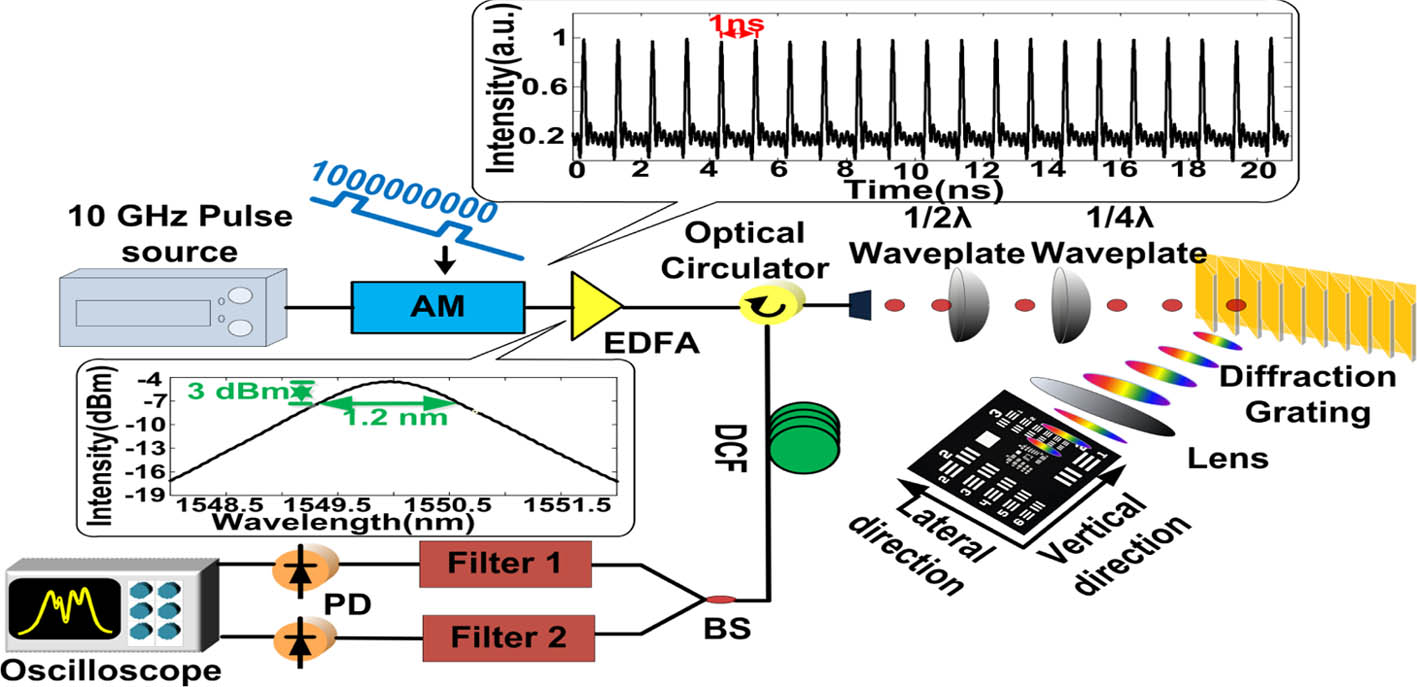
    Fig. 1. Experimental setup of the superfast serial wavelength-division line scan imaging system with 1 GHz. AM, amplitude modulator; EDFA, erbium-doped fiber amplifier; BS, beam splitter; PD, photodetector. Inset shows the temporal profile and spectrum of the amplitude-modulated 1 GHz pulse.
    Principle of this wavelength-division imaging system. Inset shows the wavelength-to-time mapping for a whole pulse and each channel’s information after filters for a single pulse. Here, T represents the period of the mode-locked pulse laser, Z is the temporal width of the dispersed pulse, B is the spectral bandwidth, D is the GVD, and W is the width of pulse filtered from each channel.
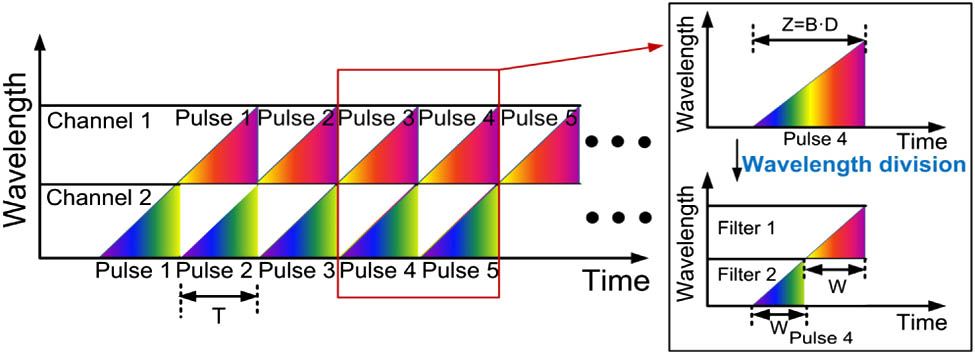
    Fig. 2. Principle of this wavelength-division imaging system. Inset shows the wavelength-to-time mapping for a whole pulse and each channel’s information after filters for a single pulse. Here, T represents the period of the mode-locked pulse laser, Z is the temporal width of the dispersed pulse, B is the spectral bandwidth, D is the GVD, and W is the width of pulse filtered from each channel.
    (a) Image of group 4 of a resolution target (USAF-1951), (b) spectrum captured from the red line in (a) measured by an optical spectrum analyzer, and (c) integrated single-shot temporal waveform captured from the red line in (a).
    Fig. 3. (a) Image of group 4 of a resolution target (USAF-1951), (b) spectrum captured from the red line in (a) measured by an optical spectrum analyzer, and (c) integrated single-shot temporal waveform captured from the red line in (a).
    (a) Temporal waveform encoded with image captured from one channel by filter 1. (b) Waveform captured from the other channel by filter 2. The figure inset shows single-shot frame information. Both channels have no temporal overlap.
    Fig. 4. (a) Temporal waveform encoded with image captured from one channel by filter 1. (b) Waveform captured from the other channel by filter 2. The figure inset shows single-shot frame information. Both channels have no temporal overlap.
    (a) 2D image acquired without wavelength-division and (b) 2D images acquired from two channels after optical filters.
    Fig. 5. (a) 2D image acquired without wavelength-division and (b) 2D images acquired from two channels after optical filters.
    (a) Reconstructed 2D image with 100 MHz scan rate and (b) reconstructed 2D image with 1 GHz scan rate. It consists of two channels, which can be discerned from the boundary.
    Fig. 6. (a) Reconstructed 2D image with 100 MHz scan rate and (b) reconstructed 2D image with 1 GHz scan rate. It consists of two channels, which can be discerned from the boundary.
    (a) Relationship diagram between T, B, D, and N, where T is the period of pulse source, B is the optical bandwidth, D is the GVD, and N is number of filters. (b) Constructed image with 1 GHz line scan rate; the 2D image is acquired with wavelength-division.
    Fig. 7. (a) Relationship diagram between T, B, D, and N, where T is the period of pulse source, B is the optical bandwidth, D is the GVD, and N is number of filters. (b) Constructed image with 1 GHz line scan rate; the 2D image is acquired with wavelength-division.
    Fangjian Xing, Hongwei Chen, Cheng Lei, Zhiliang Weng, Minghua Chen, Sigang Yang, and Shizhong Xie. Serial wavelength division 1 GHz line-scan microscopic imaging[J]. Photonics Research, 2014, 2(4): B31
    Download Citation