• Chinese Optics Letters
  • Vol. 17, Issue 1, 011101 (2019)
Zexia Zhang1、*, Jun Chang1、**, Hongxi Ren1, Kaiyuan Fan1, and Dongmei Li2、3
Author Affiliations
  • 1School of Optics and Photonics, Beijing Institute of Technology, Beijing 100081, China
  • 2University of Chinese Academy of Sciences, Beijing 100853, China
  • 3Institute of Semiconductors, Chinese Academy of Sciences, Beijing 100083, China
  • show less
    DOI: 10.3788/COL201917.011101 Cite this Article Set citation alerts
    Zexia Zhang, Jun Chang, Hongxi Ren, Kaiyuan Fan, Dongmei Li. Snapshot imaging spectrometer based on a microlens array[J]. Chinese Optics Letters, 2019, 17(1): 011101 Copy Citation Text show less
    System schematic diagram. The imaging process of a data cube, and its procedure of the down sampling and dispersive optical model.
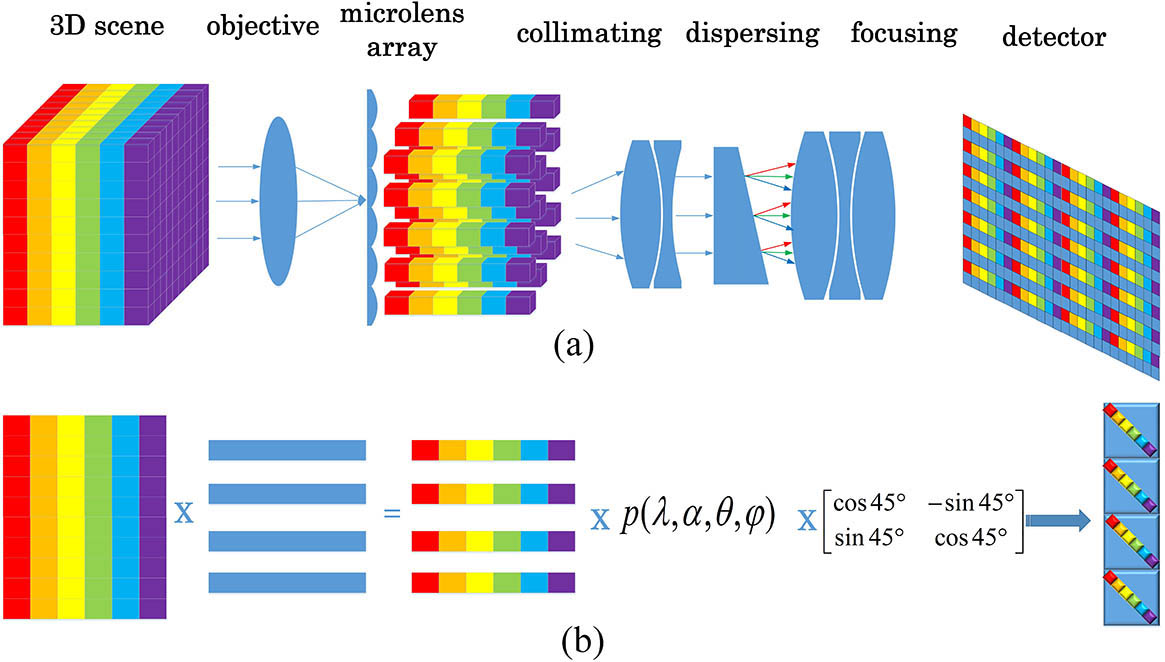
    Fig. 1. System schematic diagram. The imaging process of a data cube, and its procedure of the down sampling and dispersive optical model.
    Detailed structure of the microlens array.
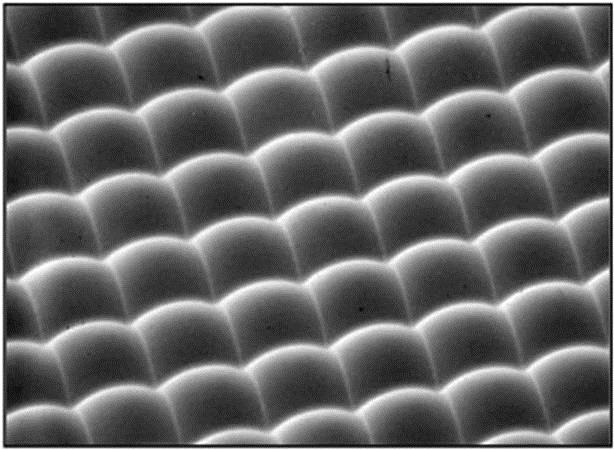
    Fig. 2. Detailed structure of the microlens array.
    Simulated diagrams of the system in Zemax. (a) The 2D layout of the final optical system. (b) The spot diagram of the system for different fields of view and different wavelengths.
    Fig. 3. Simulated diagrams of the system in Zemax. (a) The 2D layout of the final optical system. (b) The spot diagram of the system for different fields of view and different wavelengths.
    F number match diagram. (a) The F number of the objective is greater than the microlens F number, which causes gaps. (b) The F number of the objective lens is less than the microlens F number, which causes overlaps.
    Fig. 4. F number match diagram. (a) The F number of the objective is greater than the microlens F number, which causes gaps. (b) The F number of the objective lens is less than the microlens F number, which causes overlaps.
    Image plane before and after rotating 45°.
    Fig. 5. Image plane before and after rotating 45°.
    Diagram of the experimental setup. (a) The overall view of the setup. (b) The inside details of the key parts.
    Fig. 6. Diagram of the experimental setup. (a) The overall view of the setup. (b) The inside details of the key parts.
    Images of the whiteboard at different wavelengths. (a) 514.5 nm. (b) 560 nm. (c) 632.8 nm.
    Fig. 7. Images of the whiteboard at different wavelengths. (a) 514.5 nm. (b) 560 nm. (c) 632.8 nm.
    Experimental result. (a) The original graph. (b) The image of the original graph through the system.
    Fig. 8. Experimental result. (a) The original graph. (b) The image of the original graph through the system.
    Relationship between the wavelength and the pixel position.
    Fig. 9. Relationship between the wavelength and the pixel position.
    Images at different wavelengths after processing. The wavelength is from 350.67 to 770.21 nm, and the spectral interval is about 10 nm.
    Fig. 10. Images at different wavelengths after processing. The wavelength is from 350.67 to 770.21 nm, and the spectral interval is about 10 nm.
    Zexia Zhang, Jun Chang, Hongxi Ren, Kaiyuan Fan, Dongmei Li. Snapshot imaging spectrometer based on a microlens array[J]. Chinese Optics Letters, 2019, 17(1): 011101
    Download Citation