Zexia Zhang, Jun Chang, Hongxi Ren, Kaiyuan Fan, Dongmei Li, "Snapshot imaging spectrometer based on a microlens array," Chin. Opt. Lett. 17, 011101 (2019)
Copy Citation Text
This Letter proposes a snapshot imaging spectrometer, which obtains the spectral information and spatial information in one “shot”. The device proposed can achieve the data cube size of in the waveband of 400–800 nm. The core element of this system is the microlens array, which contains microlenses in a square arrangement, each microlens has an aperture of μμ, and the number is 15. The microlens array is mounted in a rotation mount, which provides 360° of rotation around the optical axis to maximize the spectral resolution. The final resolution of the system is about 10 nm.
Spectral imaging is an imaging modality that not only obtains the two-dimensional spatial image, but also the spectral information to form the three-dimensional (3D) data cube . Spectral imaging has been widely applied in a variety of fields, such as biomedical research[1–7], agricultural detection[8,9], environmental sensing[10,11], and water safety[12]. The traditional dispersive spectral imaging techniques usually scan to accomplish the acquisition of the data cube, such as whisk broom scanning, push broom scanning, and wavelength scanning. For whisk broom scanning, also called point scanning, a linear array detector is used to collect the spectral data of one spot, and two-dimensional scanning is performed to get the whole cube, while push broom scanning uses a plane array detector to realize the spectral imaging of a slit and scans in the direction perpendicular to the slit. Wavelength scanning uses a filter wheel, liquid crystal tunable filter (LCTF), or acousto-optic tunable filter (AOTF) to get the image at different wavebands [13]. Scanning makes the exposure time of the system limited, thus failing to dynamically observe moving targets.
In recent years, the snapshot imaging spectrometer, which refers to the instantaneous acquisition (in a single “shot”) of the data cube, has been paid more and more attention, and some systems relying on different technologies have been developed. In 1978, researchers put forward the idea of multispectral imaging using a color splitting prism to split incident light into three color bands, with each band observed by an independent camera[14]. Afterwards, a similar method called an image replicating imaging spectrometer (IRIS) is developed, which uses the image array and filter array to realize different waveband imaging[15]. The optical elements, such as Wollaston prisms[15], light tubes[16], thin-film filters[17], and diffractive optical elements (DOEs)[18], can achieve beam splitting and image replicating to get the data cube. But, this method is limited to the number of replicating images because of the energy segmentation. Since 2008, researchers have applied compressive sensing to snapshot spectral imaging, which modulates the light field information through a coded aperture and then disperses the incident light of different wavelengths with a custom double Amici prism[19]. Although spectral information and spatial image information can be obtained in this way, it is required that the targets and scenes must be mathematically sparse, and the hardware, e.g., a coded aperture or a digital micromirror device (DMD), causes energy loss during the imaging process.
Integral field spectroscopy (IFS), i.e., an image mapping spectrometer (IMS), is a subset of techniques in snapshot spectral imaging. IFS uses either an optical fiber array[20], mirror array[21], or microlens array[3] to break apart an image, leaving void pixel space dedicated to spectral dispersion on the detector. In the aerospace field, researchers first used a strip mirror array for image segmentation and mapping and then obtained the corresponding spectral information by the prism dispersion system. The whole optical system is difficult to process and adjust, and the volume is five times larger than that of a conventional slit spectrometer[21]. In 1972, Walraven et al. replaced the strip mirror array with a prism array, which reduced the difficulty of mounting. However, the array is limited to systems with an number , and thus it has not been widely used[13,22].
Sign up for Chinese Optics Letters TOC. Get the latest issue of Chinese Optics Letters delivered right to you!Sign up now
What is more, for a snapshot imaging spectrometer based on the optical fiber bundle, the bundle is shaped into one dimension, corresponding to the slit, and the subsequent system is similar to that of a conventional slit spectrometer, thus realizing the snapshot spectral imaging[20,23].
At present, the snapshot imaging spectrometer based on the microlens array is only used in the field of space remote sensing and microscopic fluorescence imaging. However, the large scale spectrometer in the laboratory cannot meet the requirement of portable spectrometers for practical and convenient applications. In this Letter, we use and combine the existing shelf products and the common camera lens to realize a low cost, small volume, portable snapshot imaging spectrometer device. The development of the new equipment can lay a foundation for the research of the hand-held imaging spectrometer system.
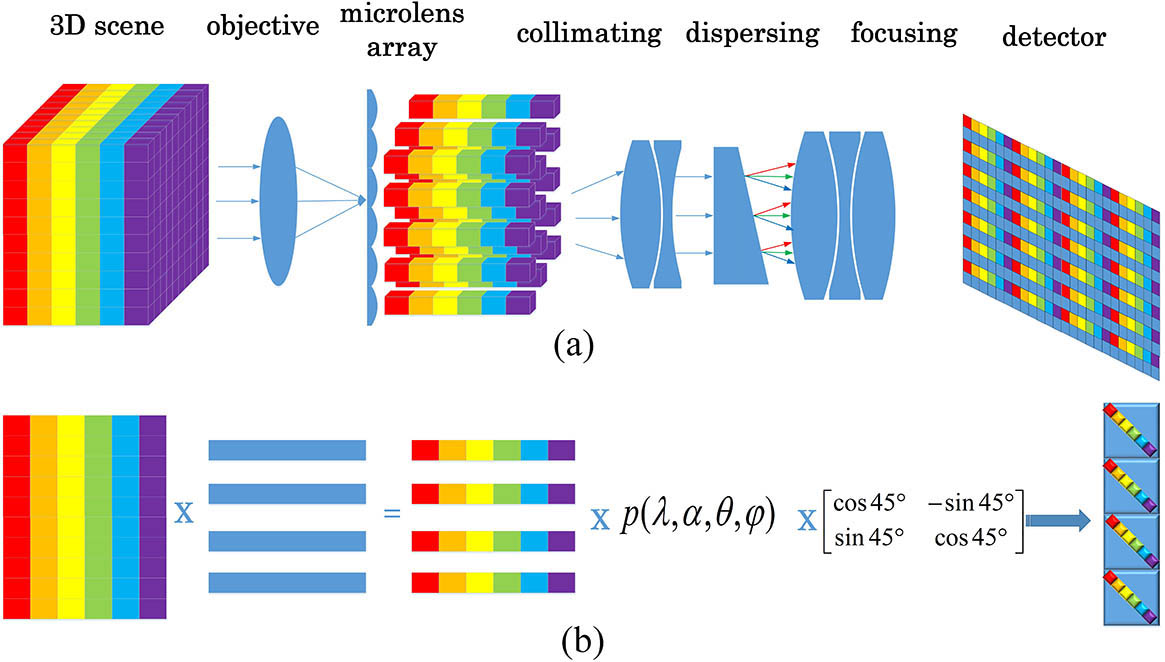
The system schematic diagram is as shown in Fig. 1.
Figure 1.System schematic diagram. The imaging process of a data cube, and its procedure of the down sampling and dispersive optical model.
A data cube carrying two-dimensional scene information and one-dimensional spectral information is first imaged at the microlens array plane through an objective. Then, the microlens array performs a two-dimensional spatial down sampling of the resulting image with the spectral information to form a sub-image array. The 3D data cube after down sampling is imaged at the detector by a dispersion system, including a collimating, dispersing, and focusing group, as shown in Fig. 1. The optical function of the dispersion system is to project the spectral information of the object to the detector plane. The detector receives the image array of different positions, and each of them contains the whole waveband information, but different wavelengths are at different spatial positions. The actual imaging process is given by where is the aperture of each microlens, is the centroid coordinate of the sub-image, are the numbers of the microlens in two directions , is the top angle of the dispersive prism, are the incident and exit angles for the prism, and is the rotation transformation matrix.
The image formed by the object data cube through the objective and the microlens array includes sub-images . The combination of these sub-images is the spatial two-dimensional image. These sub-images are then imaged through the dispersion system, including a collimating, dispersing, and focusing group. After that, each sub-image has a one-to-one relationship between the coordinates and the wavelength, which is related to the prism pose. These images form the spectral sub-image . The dispersion of wavelength through a prism function is defined as .
The centroid coordinate of the sub-image is obtained by using the white light source image, and each spectral sub-image is solved by where is the pixel number of each sub-image. In each spectral sub-image, the corresponding relationship between wavelength and pixel is obtained by interpolation.
According to the above theory, the optical simulation is carried out in the optical design software Zemax (Zemax, USA). The wavelength range is set to be 400–700 nm, the focal length of the objective is 50 mm, and the number is 22. The microlens array is arranged in a square array on a glass plate, for which the refractive index is at 633 nm. Each microlens with an number of 15 has a full aperture of μμ. The details are as shown in Fig. 2.
Figure 2.Detailed structure of the microlens array.
The focal lengths of the collimating lens and the focusing lens are 40 and 75 mm, respectively. The top angle of the prism is 11°22′, and its material is Schott BK7. The final optical system and imaging spot radius are as shown in Fig. 3.
Figure 3.Simulated diagrams of the system in Zemax. (a) The 2D layout of the final optical system. (b) The spot diagram of the system for different fields of view and different wavelengths.
The dispersion ability of the prism is measured by angular dispersion , which is calculated by the following equation: where is the top angle of the prism, is the dispersion rate of the prism material, which indicates the degree of the refractive index change with the wavelength, and are the refraction angle of the first and second sides of the prism. The linear dispersion is where is the focal length of the focusing lens.
Each sub-image size is where are the numbers of the objective, the microlens, the focusing group, and the collimating group, is the size of each microlens, and is the width of all of the spectral information in the entire sub-image.
The spectral resolution (nm/pixel) is
Therefore, the spectral resolution is mainly related to the above parameters. is related to the prism material, is the aperture of each microlens, and is the top angle of the prism. These three parameters are about the system hardware and cannot be changed arbitrarily. Therefore, the adjustable parameters of the spectral resolution are the numbers of the collimating lens and the focusing lens and the focal length of the focusing lens. When the spectral resolution of the system improves, will decrease, and the field of view will decrease. The number of sub-images is related to the detector width, which is given by where is the width of the detector, and is the number of sub-images in one dimension. When the spectral resolution is improved, remains the same, and then decreases, that is, the field of view is reduced. Therefore, the field of view and spectral resolution are mutually restrictive.
What is more, when the number of the objective is larger than the number of the microlens, there will be gap between sub-images. If the number of the objective is less than the number of the microlens, there will be overlap between the sub-images, and that is shown in Fig. 4. The overlap is strictly impermissible.
Figure 4. number match diagram. (a) The number of the objective is greater than the microlens number, which causes gaps. (b) The number of the objective lens is less than the microlens number, which causes overlaps.
The arrangement of the sub-images is the same as the microlens in the microlens array, and the dispersion direction is the same as the placement direction of the prism. The rotation of the microlens array can change the relative arrangement of these two directions and then change the distribution of the pixels in the sub-images. Considering that, the system is rotated 45° after the dispersion group to improve the system spectral performance as much as possible, as shown in Fig. 5.
Figure 5.Image plane before and after rotating 45°.
On the same size target detector, the overlap between different wavelengths is avoided, and the detector utilization and spectral resolution are improved.
The experimental setup is composed of off-shelf products, as shown in Fig. 6. A camera lens with the focal length of 50 mm and number of 22 is utilized as an objective to image the 3D scene. Two doublet achromatic lenses (GCL-010651, GCL-010654, Daheng, China) are used as the collimating group and the focusing group. The microlens array is MLA-S125-f15 from the RPC Company, and the microlens diameter is μ, arranged in a square on the glass plate with the number of 15. It is fixed on a rotatable frame (GCM-0902M, Daheng, China) so that the image could be rotated in the same direction that the microlens array rotates. The top angle of the dispersion prism (PS812 NBK7, Thorlabs) is 11°22′. A lens tube (SM104, Thorlabs, USA) is used to align these elements. The light between the collimating group and the prism is parallel, so the distance between them is not sensitive. A 1/2 in. 3 million pixel color complementary metal–oxide–semiconductor (CMOS) image sensor transports the image signal to the computer, of which the pixel size is μμ, and the image size is . The white light source (GCI-060101, Daheng, China) is used for 45° illuminating, and the camera is observed at 0° to eliminate the influence of specular reflection. The color camera is used because the pixel size of the camera is small, which is suitable for the experiment. Although each pixel of the color camera has the Bayer mask, it can still record the intensity information of the whole band and acquire the red–green–blue (RGB) image. The spectral information of the scene in this system is recorded on the intensity of pixels at different positions, that is, the intensity of different wavelengths is represented by the gray level of pixels at different positions.
Figure 6.Diagram of the experimental setup. (a) The overall view of the setup. (b) The inside details of the key parts.
In the experiment, a whiteboard was first taken to prepare for the subsequent calibration. The filters of three different wavelengths were used for the calibration, including 632.8, 560, and 514.5 nm, and the corresponding images are shown in Figs. 7 and 8.
Figure 7.Images of the whiteboard at different wavelengths. (a) 514.5 nm. (b) 560 nm. (c) 632.8 nm.
The MATLAB software (MATLAB, USA) is used for the image processing, the interpolation method is used to correct the relationship between the wavelength and the pixel position, and the radiation correction is made by the following formula: where are the intensity of the object, the background, and the whiteboard, respectively.
Using the filters at the wavelengths of 514.5, 560, and 632.8 nm, the relationship between the wavelength and the pixel position is obtained by the interpolation method, as shown in Fig. 9. The image is processed with MATLAB, and then the two-dimensional images at dedicated wavelengths are obtained by combining the pixels in every sub-image. The different spectral spatial images constitute the final 3D data cube. The system finally realizes the data cube size of . The spectral resolution of the system is about 10 nm (Fig. 10).
Figure 9.Relationship between the wavelength and the pixel position.
We have designed and tested a snapshot spectral imaging device based on the microlens array. A data cube of the size of is demonstrated with the consumer grade off-shelf optics, including the objective, microlens array, collimating lens, focusing lens, and prism. Calibration procedures for the device are also presented in this Letter. The key step is to establish the one-to-one correspondence between voxels in the data cube and pixels on the camera. Potential improvements can be made to obtain larger data cubes by using optimized, high-performance optics, and the entire pixel space. This prototype also has significant potential to open up new areas of investigation in medical applications by combining it with lenses, such as electric endoscope and fundus camera. If a beamsplitter is applied in front of the microlens array of our system in the electric endoscopes and fundus cameras to separate another light path to obtain the spatial image, the high-resolution spatial image can be obtained while we can acquire the 3D data cube. Although the system is more complex, it will help a lot to diagnose normal and pathological tissues by the reflectance difference. For example, it is capable of capturing the retinal vessel oxygenation and molecules (hemoglobin, macular pigment, melanin) and cell types within the retina[24].
Zexia Zhang, Jun Chang, Hongxi Ren, Kaiyuan Fan, Dongmei Li, "Snapshot imaging spectrometer based on a microlens array," Chin. Opt. Lett. 17, 011101 (2019)