Abstract
![]()
![]() All-inorganic CsPbBr3 perovskite quantum dots (QDs) have received great attention in white light emission because of their outstanding properties. However, their practical application is hindered by poor stability. Herein, we propose a simple strategy to synthesize excellent stability and efficient emission of CsPbBr3 QDs by using 2-hexyldecanoic acid (DA) as a ligand to replace the regular oleic acid (OA) ligand. Thanks to the strong binding energy between DA ligand and QDs, the modified QDs not only show a high photoluminescence quantum yield (PLQY) of 96% but also exhibit high stability against ethanol and water. Thereby warm white light-emitting diodes (WLEDs) are constructed by combining ligand modified CsPbBr3 QDs with red AgInZnS QDs on blue emitting InGaN chips, exhibiting a color rendering index of 93, a power efficiency of 64.8 lm/W, a CIE coordinate of (0.44, 0.42) and correlated color temperature value of 3018 K. In addition, WLEDs based on ligand modified CsPbBr3 QDs also exhibit better thermal performance than that of WLEDs based on the regular CsPbBr3 QDs. The combination of improved efficiency and better thermal stability with high color quality indicates that the modified CsPbBr3 QDs are ideal for WLEDs application.
All-inorganic CsPbBr3 perovskite quantum dots (QDs) have received great attention in white light emission because of their outstanding properties. However, their practical application is hindered by poor stability. Herein, we propose a simple strategy to synthesize excellent stability and efficient emission of CsPbBr3 QDs by using 2-hexyldecanoic acid (DA) as a ligand to replace the regular oleic acid (OA) ligand. Thanks to the strong binding energy between DA ligand and QDs, the modified QDs not only show a high photoluminescence quantum yield (PLQY) of 96% but also exhibit high stability against ethanol and water. Thereby warm white light-emitting diodes (WLEDs) are constructed by combining ligand modified CsPbBr3 QDs with red AgInZnS QDs on blue emitting InGaN chips, exhibiting a color rendering index of 93, a power efficiency of 64.8 lm/W, a CIE coordinate of (0.44, 0.42) and correlated color temperature value of 3018 K. In addition, WLEDs based on ligand modified CsPbBr3 QDs also exhibit better thermal performance than that of WLEDs based on the regular CsPbBr3 QDs. The combination of improved efficiency and better thermal stability with high color quality indicates that the modified CsPbBr3 QDs are ideal for WLEDs application.Introduction
Nowadays, lighting accounts for approximately one-fifth of the global electricity consumption1, which leads to a large increase in the emissions of carbon dioxide (CO2)2. To reduce the energy demand for lighting, solid-state white light-emitting diodes (WLEDs) are becoming the most promising illumination sources, which are much more efficient, energy saving and environmental friendly than that of the traditional bulbs and fluorescent lighting sources3-6. A common way of achieving a white light emission is composed of a near-UV or blue LEDs with a coating of either down-conversion materials (i.e. YAG:Ce3+ phosphors) or a combination of red and green phosphors7, 8. Unfortunately, such WLEDs suffer from poor white light performance after extensive use due to the different degradation rates between the blue LEDs and phosphors. In addition, they usually exhibit unsatisfactory high correlated color temperature (CCT) value and a low color rendering index (CRI <80) due to the facile absence of the red or green emission. In principle, an ideal white light emitting system needs the light source with an appropriate CCT between 2500 K and 6500 K, and CRI above 80 9, 10. In order to achieve high performance WLEDs, developing a highly efficient red and green quantum dots (QDs) for high CRI value of warm WLEDs is a very attractive strategy.
Recently, all-inorganic perovskite quantum dots (QDs) CsPbX3 (X = Cl, Br, I) have rapidly advanced the optoelectronic fields owing to their remarkable optical performance, such as high photoluminescence quantum yield (PLQY), narrow emission bandwidths and tunable wavelength11-13. Because of these superior properties, CsPbX3 QDs can be elaborately designed for a series of optoelectronic devices including solar cells, photodetectors, lasers and light-emitting diodes14-18. In particular, owing to the nature of their facile color tunability and sharp emission, such unique characteristics enable the luminescence CsPbX3 QDs to be very promising emitting materials for LEDs19. For example, Zeng’s group first reported the blue, green and yellow LEDs based on the CsPbX3 QDs20. Li et al. and Ling et al. have both reported their LEDs based on CsPbBr3 QDs with about 6% EQE21, 22. Up to now, many strategies have been taken to achieve high efficiency perovskite LEDs, including the compositional engineering, utilizing surface engineering and dimensional engineering21, 23-29. In addition, based on the green CsPbBr3 QDs, it is possible to realize the high quality warm WLEDs because of their color purity and color gamut. For example, Song and co-workers realize a highly efficient white light generation in LEDs using CsPbBr3 QDs with red phosphor on InGaN blue chip30. Chen et al. designed CsPbBr3 QDs/PMMA composites and obtained a WLEDs with a CRI of 89.231. Regardless of the rapid progress in WLEDs using perovskite QDs, CsPbBr3 QDs still suffer from problems related to poor humidity and poor thermal stability, which restrict the development of high performance WLEDs32, 33. The poor stability of CsPbBr3 QDs is mainly related to the surface defect, surface long ligands and ionic migration behaviors34-36. For example, QD dissolution may occur under the surrounding of polar solvents or thermal conditions, resulting in poor stability and luminescence37-39. To improve the stability of CsPbBr3 QDs, a variety of strategies have been developed, including coating an inert material, surface treatment and doping/alloying heteroatoms40-44. In fact, among those different methods in improving the stability of CsPbBr3 QDs, ligand modification is a very simple and effective approach37, 45. During the initial stages of ligand research for CsPbBr3 QDs, most ligands were used for the enhancement of surface coverages and suppression of surface defects of QDs46. However, these ligands on the surface of QDs are very labile. Specifically, they are readily desorbed during the purification process resulting in incomplete surface passivation and poor luminescence efficiency. The main reason for this problem is the poor binding energy between the ligand and QDs. Recently, the most ideal ligands that bind more strongly to the surface can improve luminescence and stability of CsPbBr3 QDs, such as propanesulfonate and alkyl phosphonic acids37, 47. In other words, the effective ligand modification strategy of CsPbBr3 QDs is fundamental to synthesize high quality QD with excellent optical properties, enhancing the stability and improving device performance.
In addition, it is worth pointing out that the full-width at half-maximum (FWHM) of the red-emitting component is a very important factor for realizing high performance WLEDs48-51. In terms of the optionally red-emission materials for the WLEDs, the red-emission CsPbI3 perovskite QDs suffer from poor stability and narrow FWHM of the emission spectrum52, 53. Particularly, the perovskite phases of red CsPbI3 QDs have been demonstrated to be metastable under ambient conditions and they easily undergo a phase transition resulting in diminishing their optical properties54-56. Consequently, for obtaining the high performance warm WLEDs, the red-emission AgInZnS QDs with a wide FWHM of 90 nm is suitable and chosen to act as the red component for the warm light emission57, 58.
In this work, we present a facile strategy to achieve excellent stability of CsPbBr3 QDs and high performance of WLEDs by using shorter 2-hexyldecanoic acid (DA) ligand to replace OA ligand for CsPbBr3 QDs. The ligand modified CsPbBr3 QDs exhibit a high PLQY of 96% with significantly enhanced stability, even when exposed to ethanol and water environments. Consequently, WLEDs by combining a blue InGaN LED with green ligand modified CsPbBr3 QDs and red AgInZnS QDs are achieved, which generate high quality warm white light emission with a power efficiency of 64.8 lm/W, CRI of 93, color coordinate of (0.44, 0.42), and correlated color temperature (CCT) of 3018 K. In particular, the WLEDs based on the modified CsPbBr3 QDs show a good thermal performance under high driving current, verifying their potential application in the field of solid-state lighting.
Experimental
Chemicals and reagents
Lead bromide (PbBr2, 99.9%) and Cesium carbonate (Cs2CO3, 99.9%) were purchased from Xi’an polymer Light Technology Corp. Octadecene (ODE, > 90%, Adamas), OA (>90%, Adamas), DA (>98%, TCI), OAm (>90%, Aladdin). Silver nitrate (AgNO 3, 99.8%, Aldrich), zinc stearate (Zn(St)2, 90%, Aldrich), indium acetate (In(Ac)3, 99.99%, Aldrich), n-dodecylthiol (DDT, 99.8%, Aladdin), sulfur (S, 99.99%, Aldrich). All these reagents were used without further purification.
Preparation and characterization of materials
Synthesis of CsPbBr3-OA QDs
4 mL of ODE, 0.5 mL of OA and Cs2CO3 (81.5 mg) were loaded into a 100 mL three-neck flask 1, PbBr2 (0.188 mmol) and 5 mL of ODE were loaded into another 100 mL three-neck flask 2. Both the two flasks were degassed under vacuum and nitrogen flow and then heated to 120 °C. After 1 h, 0.5 mL of OAm and 0.5 mL of OA were quickly injected into flask 2, and then the temperature was raised to 150 °C to ensure complete dissolution. Keep the mixture at 150 °C about 2 min and then Cs-oleate solution (0.4 mL in ODE) was quickly injected. After 5 s, the solution turned green immediately and the reaction mixture was cooled by the ice-water bath to room temperature.
Synthesis of CsPbBr3-DA QDs
4 mL of ODE, 0.5 mL of DA and Cs2CO3 (81.5 mg) were loaded into 100 mL three-neck flask 1, PbBr2 (0.188 mmol), ODE (5 mL), OAm (0.5 mL) and DA (0.5 mL) were loaded into another 100 mL three-neck flask 2. Both the two flasks were degassed under vacuum and nitrogen flow and heated to 120 °C in 1 h under nitrogen flow. Temperature was set up to 150 °C to ensure complete dissolution, keeping the mixture at 150 °C for 2 min and then Cs-oleate solution (0.4 mL in ODE) was quickly injected. After 5 s, the solution turned green immediately and the reaction mixture was cooled by the ice-water bath to room temperature.
Synthesis of AgInZnS QDs
In(Ac)3 (0.4 mmol) and AgNO3 (0.1 mmol) were added in ODE (4 mL), OA (0.2 mL) and n-dodecylthiol (0.75 mL) in a 50 mL three-neck flask 1, followed by the solution was heated to 60 °C under nitrogen flow. Meanwhile, the sulfur (0.5 mmol) was dissolved in OAm (0.5 mL) and ODE (0.5 mL) solution in bottle 1. The Zn(St)2 (0.5 mmol) was dissolved in OAm (0.5 mL) and ODE (0.5 mL) solution in bottle 2. After 30 min, the mixture solution was heated to 90 °C for 10 min. The sulfur solution (total solution in bottle 1) was quickly injected into the flask 1. Then flask 1 was set up to 115 °C, subsequently, the Zn(St)2 solution (total in the bottle 2) was slowly injected. The reaction solution was kept at 115 °C for 35 min for the formation of AgInZnS QDs. The crude reaction solution was centrifuged at 9500 rpm for 10 min after adding some toluene. The obtained supernatant was added in ethanol solvents (according to 1:3 by volume) and precipitated again, the supernatant was discarded and obtained the purified AgInZnS QDs. The AgInZnS were eventually dispersed in n-hexane.
Preparation of materials
Purification of CsPbBr3 QDs
The crude solution was evenly split into two centrifuge tubes and the equal volume of n-butanol was added to each tube. The above mixture solution was centrifuged at 9000 rpm for 5 min. After centrifugation, the supernatant was discarded. Then, the precipitate was washed with toluene to remove large particles and agglomerates.
Fabrication of CsPbBr3 QDs films
The CsPbBr3 QDs films were fabricated onto the glass substrates by drop-coating the QDs solution under ambient conditions.
Characterization of materials
The XRD patterns were collected using monochromatized Cu Ka radiation (XRD-6100, SHIMADZU, Japan). The TEM images were obtained on an electron microscope (Libra 200 FE, Zeiss, Germany). Absorption spectra were adopted recorded on a UV–vis spectrophotometer (UV–vis: UV-2100, SHIMADZU, Japan). The photoluminescence spectroscopy was performed using a fluorescence spectrophotometer (PL: Agilent Cary Eclipse, Australia). The FTIR analysis (KBr pellet method) was performed with a Nicolet iS50 FT-IR Spectrometer (Thermo Fisher Scientific, Waltham, MA, USA) to characterize the product structure of EJTLE. The AFM images were recorded by an atomic force microscope (Asylum Research, MFP-3D-BIO, USA). All NMR spectra were collected on a Bruker 400M system. The XPS analysis was carried out using an Escalab 250 Xi system. The performances of the fabricated WLEDs were measured using a spectrograph of PR670 with an analyzer system.
Fabrication of white LED devices
Typically, the polymethyl-methacrylate (PMMA, 15 mg) and CsPbBr3 QDs (25 mg) were dissolved in 20 mL toluene and stirred for 24 h. Similarly, PMMA (15 mg) and AgInZnS QDs (30 mg) were all dissolved in 20 mL toluene and stirred for 24 h. To fabricate WLEDs, the above obtained two mixture solution were successively dropped on a blue InGaN chip. The fabricated WLED was annealed at 40 °C for 30 min in the ambient.
Computational details
The density functional theory calculations are performed using the FHI-aims code59. We use the generalized-gradient-approximation (GGA) exchange-correlation functional in the form of Perdew-Burke-Ernzerhof (PBE)60. The long-range van der Waals interaction is considered using the Tkatchenko-Scheffler correction61.
Results and discussion
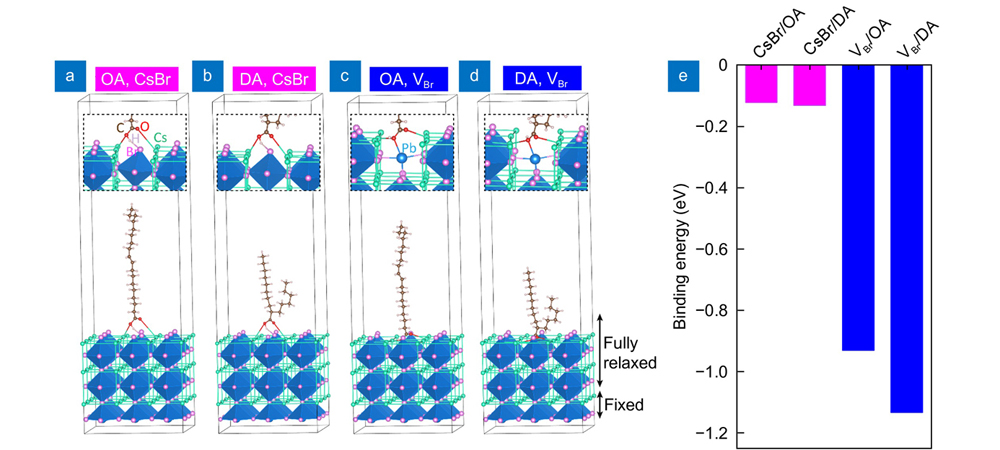
Figure 1(a–d) shows the surface models for simulating the OA/DA adsorption on the CsPbBr3 surfaces. The surface models contain large vacuum spaces (i.e.,~18 Å and ~45 Å (1 Å=10–10 m) within the planar directions and along with the vertical directions, respectively) to avoid the interaction between molecules and their images. Whereas the bottom CsPbBr3 layer is fixed to their bulk structural parameters, the upper two CsPbBr3 layers are fully relaxed to simulate the surface effects and also their bonding interactions with the molecules. The structure models are carefully relaxed since the numerical convergence could sensitively influence the validity of the calculated binding energies (see more details in the Supporting Information). Figure 1(e) shows the binding strengths of OA/DA with CsPbBr3 with four different adsorption models, which indicates that DA has a stronger binding ability than OA. We first consider OA/DA adsorptions on the pristine CsBr-terminated surfaces (Fig. 1(a-b)), which is the most common termination surfaces of CsPbBr3 quantum dots62. The hydrogen atom from the COOH group is initially placed on top of a Br anion, since it was usually believed that the small molecules bind with the CsBr-surfaces through hydrogen bonding59, 60. We then carefully relax the surface structure in order to find the most stable adsorption configurations. For the structure models of Fig. 1(a) and 1(b), our results (see Fig. 1(e)) indicate, strictly speaking, a stronger binding ability of DA (Ebinding = −0.136 eV) than OA (Ebinding = −0.127 eV). However, we point out that the binding energies from these models are quite small, which is understood from the below analysis of the bonding interactions between the molecules and CsBr surface. The distortion patterns of the PbBr6 octahedra around the adsorption sites (see the insets of Fig. 1(a) and 1(b)) clearly reveal, contrary to the previous understanding63, 64, a mutual repulsion between H and Br atoms. Therefore, the H-Br repulsion partially compensates the electrostatic attraction between the O anion and Cs cation (from the COOH group and the CsBr surfaces, respectively), resulting in weak binding energies.

Figure 1.Relaxed surface models for simulating the adsorption of OA/DA molecules on the CsPbBr3 surface. The insets are the zoomed-in plot of the bonded regions. (a) OA on top of the pristine CsBr-terminated surface. (b) DA on top of the pristine CsBr-terminated surface. (c) OA bonding with a Br-vacancy. (d) DA bonding with a Br-vacancy. (e) The binding energies of the four interfaces.
Table Infomation Is Not EnableTable Infomation Is Not Enable
Much stronger binding of both OA and DA molecules is found in the presence of Br-vacancies (see Fig. 1(c) and 1(d)), agreeing well with the previous report62. When constructing the structure models, one Br atom is removed from the CsBr surfaces, and the molecular H atom is initially placed on top of the exposed Pb atom. Structural relaxations (of the Fig. 1(c) and 1(d) models) move the H atom (in the COOH group) toward void spaces created by the Br-vacancy, which effectively avoids the H-derived repulsion interactions as discussed earlier. The local bond networks (see the insets of Fig. 1(c) and 1(d)) show the bonding of one O-Pb pair and two O-Cs pairs. Therefore, it is not surprising that both DA and OA have much strong binding energies on these Br-defective surfaces (Ebinding = −0.933 and −1.135 eV for the OA and DA adsorption structures, respectively). Moreover, as shown in Fig. 1(e), the binding of a DA ligand with the CsPbBr3 QDs is clearly more stable, i.e., ΔE = 0.202 eV, than that of an OA ligand.
To confirm our calculation results, the pristine CsPbBr3-OA QDs were synthesized via the conventional hot-injection method using lead bromide and cesium oleate as precursors. However, the CsPbBr3-DA QDs were synthesized using a modified hot-injection method. The synthesis process of the modified CsPbBr3 QDs by using 2-hexyldecanoic acid (DA) as a ligand to replace the regular oleic acid (OA) ligand is schematically shown in Fig. 2(a), and the detailed synthesis process could be found in our experimental section. As shown in Fig. 2(a), OA ligand is composed of the long carbon chain, while DA ligand is composed of two short branched chains. The previous reports have been demonstrated that using short ligands to replace the regular long ligands is an effective strategy to enhance the stability of QDs62, 65-69. These former reports inspired us to choose the DA ligands with two short branched chains for the synthesis of CsPbBr3 QDs. Besides, it is a reasonable hypothesis that DA ligand with the two short branched chains may increase the binding energy between QDs and the ligand, resulting in significantly enhanced stability of QDs. Figure 2(b) shows the photographs of the synthesized CsPbBr3 QD solutions under daylight (left) and UV light excitation (right). In comparison with the CsPbBr3-OA QDs solution, the CsPbBr3-DA QDs solution exhibit better clarification under daylight and brighter green luminescence under the UV lamp (365 nm). The measured PLQY of CsPbBr3-OA QDs is only 84%, while the PLQY of CsPbBr3-DA QDs is 96%. Figure 2(c) shows the high-resolution transmission electron microscopy (HRTEM) images of the CsPbBr3-OA QDs and CsPbBr3-DA QDs in which the cubic structure and the lattice fringes of 0.58 nm for both QDs are clearly demonstrated.
Fig. S2 present the low-resolution TEM images of the two CsPbBr3 QDs. The elemental mapping results exhibit a uniform distribution of Cs, Pb, and Br atoms in the two CsPbBr3 perovskite QDs (see
Fig. S3). X-ray diffraction (XRD) data has further confirmed the phase purity and crystallinity of both CsPbBr3 perovskite QDs (see Fig. 2(d)). The diffraction peaks at 2θ values of 15.2°, 21.7° and 30.7°, corresponding to (100), (110) and (200) facets of standard CsPbBr3 QDs, which indicate the high-quality cubic phase for two CsPbBr3 QDs. Obviously, the XRD results are agreed well with the HRTEM images. As described in
Fig. S4(a–d), the X-ray photoelectron spectroscopy (XPS) has been recorded to investigate the chemical composite of the two CsPbBr3 QDs. The peaks originating from Cs 3d, Pb 4f and Br 3d electrons have been labeled, and have energies consistent with the CsPbBr3 perovskite QDs70. In addition, the spectra show no different signals between CsPbBr3-OA and CsPbBr3-DA QDs. These XPS characterizations also echo our XRD results and HRTEM images, indicating that the synthesis of CsPbBr3 QDs with DA ligand modification is successful. The chemical bonds of the CsPbBr3-OA QDs and CsPbBr3-DA QDs surface were determined by transform infrared (FTIR) spectroscopies. Figure 2(e) shows the FTIR spectra of the CsPbBr3-OA QDs and CsPbBr3-DA QDs. It is well known that the FTIR spectra are dominated by the vibrational modes of bound and unbound ligand molecules in the QDs surfaces. The peaks of 2921 cm−1 revealed the resonances of hydrocarbon chains with methyl (−CH3). The peaks at 706 cm−1 are characteristic peaks of −(CH2)n− in long chain saturated hydrocarbons. In particular, the peaks show the typical C−O stretched and C−O bends, indicating the existence of the acid ligand on the QD surface. The peak centered at 1462 cm−1 is attributed to stretching vibrations of DA group and OA group, indicating that the OA and DA ligands were both well capped on CsPbBr3 QDs after purification. To gain further insight into the differences between the DA and OA ligands, we characterized the two samples by quantitative 1H nuclear magnetic resonance (NMR) spectroscopy. The representative 1H NMR spectrum of both purified CsPbBr3 QDs solution is given in Fig. 2(f). We focus specifically on the signal region (δ = 2−3 ppm) of the 1H NMR spectrum, which allows for analysis of acid ligand (OA or DA ligand) binding on the QDs surface71. Just like CsPbBr3-OA QDs, it is obvious that a H peak from –COOH group is observed in CsPbBr3-DA QDs, implying that DA ligand was bound to QDs surface. Hence, the DA ligand could bind to the QDs surface tightly and cap the QDs well.
Figure 2.(a) The schematic illustration of the surface in the CsPbBr3 QDs with ligand modification process. (b) Photographs of the CsPbBr3 QDs solution under the daylight (left) and UV light of 365 nm (right). (c) HRTEM images. (d) XRD patterns. (e) FTIR spectra. (f)1H-NMR spectra after washed twice.
In Fig. (3), we show the PL emission spectra and the UV-vis absorption for both CsPbBr3 QD films with the same thickness of 500 nm, which were measured under the same condition. We observe that the PL emission spectra in Fig. 3(a) are dominated by the emission peak at around 517 nm, consistent with the previous reports72. As we expected, CsPbBr3-DA QD films exhibit a significantly enhanced PL intensity. In contrast to the PL spectra, we observe a single absorption peak at 510 nm, indicating a significant occurrence of the Stokes shift (as shown in Fig. 3b)73. It has been demonstrated that this shift is intrinsic to the QDs electronic structure. Additionally, the PL decays of both CsPbBr3 QDs have been recorded in Fig. 3(c). Both of the two curves can be fitted with biexponential decay, the fitted parameters are shown in the inset table of Fig. 3(c), including the fast-decay component (radiative recombination lifetimes, τr), a slow-decay component (nonradiative recombination lifetime, τnr) and the average lifetimes (τavg). The two decay curves show that the CsPbBr3-DA QDs and CsPbBr3-OA QDs films have the τavg lifetimes of 26.4 and 19.5 ns, respectively. In comparison with CsPbBr3-OA QDs films, the longer lifetime of CsPbBr3-DA QDs films likely caused by the surface defect passivation and high crystallinity in the presence of DA ligands. Therefore, the ligand replacement from OA to DA can facilitate the optical performance improvement of CsPbBr3 QDs, including the increasing decay lifetime and lower surface defect density. Considering the film quality plays an important role in governing the performance of perovskite WLEDs, we next characterized the morphology of CsPbBr3 QD films by the atomic force microscopy (AFM). We drop-coated the QDs solution on the glass substrate with the same thickness of the layer used for the following WLEDs. Interestingly, we find that the uniformity of CsPbBr3-DA QDs films is much better than that of CsPbBr3-OA QDs films. The root mean square (RMS) roughness of CsPbBr3-OA QDs film is 12.71 nm (Fig. 3(d)). By contrast, the CsPbBr3-DA QDs films show a much lower RMS value of 7.62 nm (Fig. 3(e)). It is expected that the DA ligands could passivate the surface defects and mitigate the agglomeration of the CsPbBr3 QDs, leading to the high quality films.
Figure 3.(a) PL spectra. (b) Absorption spectra. (c) PL decays and (d, e) AFM images of the QDs films.
To further evaluate the stability of the synthesized CsPbBr3 QDs, both CsPbBr3 QDs under the ethanol surrounding were explored. Fig. 4(a) shows the photographs of both CsPbBr3 QDs solution subjected to the ethanol surrounding under the daylight and UV light. Both CsPbBr3 QDs solutions exhibit clarification and brightness at the beginning of the measurement. Obviously, the CsPbBr3-DA QDs solution is much brighter than that of the CsPbBr3-OA QDs solution (left in Fig. 4(a)). When the equal amount of 0.5 mL ethanol is added, the CsPbBr3-OA QDs solution rapidly turns to deep yellow under the daylight and the fluorescence also becomes dim under UV light. By remaining them in the ethanol for 90 min, the CsPbBr3-OA QDs solution has become a homogeneous yellow mixture under the daylight, which emit a dim green light under UV light. By contrast, the CsPbBr3-DA QDs solution can still remain green and clear and keep a higher luminescence brightness (right in Fig. 4(a)). Figure 4(b) and 4(c) show the PL evolution of the CsPbBr3-OA QDs and CsPbBr3-DA QDs after mixed with 0.5 mL ethanol under the same measurement, respectively. As shown in Fig. 4(b), the PL intensity of CsPbBr3-OA QDs exhibits a severe decrease with the time increasing. In contrast, the CsPbBr3-DA QDs still maintained their 66% of initial PL intensity even in the ethanol for 90 min (see Fig. 4(c)), indicating its stronger polar solvent resistance. Figure 4(d) provides a straight view on the degradation tendency of PL intensity, in which the stability of CsPbBr3-DA QDs is much better than that of CsPbBr3-OA QDs under the ethanol surrounding. In addition, the emission wavelength of the CsPbBr3-OA QDs gradually performed a red shift with the time increase, indicating the structural degradation and aggregation with ligands loss in ethanol conditions. In contrast, the emission wavelength of the CsPbBr3-DA QDs has no shift. It is evident that the DA ligand could enhance the stability of CsPbBr3 QDs, which should be due to the strong interaction between QDs and DA ligands74.
Figure 4.CsPbBr3-OA QDs and CsPbBr3-DA QDs in ethanol. (a) Photographs. (b, c) PL spectra. (d) PL intensity variation of QDs solutions over 90 min.
To gain more insight into the stability of the DA ligand modified CsPbBr3 QDs, we explore the water stability on both CsPbBr3 QD solution. The equivalent amount of both solid CsPbBr3 QDs were dispersed in the 1.5 mL toluene to obtain the clear solution. The above solutions were added into the 2 mL ultrapure water. Figure 5 shows both CsPbBr3 QD solutions subjected to the ultrapure water under daylight and UV light. The color of CsPbBr3-OA QDs solution changes from clear and green to colorlessness with the time increase under day-light and UV light, respectively, indicating that the CsPbBr3 perovskite structure is destroyed. Impressively, the green luminescence of the CsPbBr3-DA QDs solution still retain even after 7 days and maintain the PLQY of 75.2%. Therefore, it can be concluded that DA ligand modification is indeed beneficial to greatly improve the stability of CsPbBr3 QDs and significantly suppress the degradation.
Figure 5.Photographs of CsPbBr3 QDs solution under daylight and UV light of 365 nm.
As discussed above, we have obtained green CsPbBr3-DA QDs with high-quality and excellent stability. In order to fabricate the WLEDs, AgInZnS QDs were chosen to act as the red emission. The photographs, XRD pattern, absorption and PL emission spectra of the red AgInZnS QDs are shown in
Fig. S5, respectively.
Figure S5(a) presents the photograph of AgInZnS QD solution under the daylight and UV light.
Fig. S5(b) shows the XRD patterns of AgInZnS QDs.
Obviously, the XRD patterns of the samples match well with that of standard phase crystal structure, and there is no impure peak.
Figure S5(c) describes the absorption of the AgInZnS QDs.
Figure S5(d) shows the red PL emission of AgInZnS QDs with centered emission peak at 610 nm, which agrees well with the previous published work57. XPS is further applied to characterize the crystals of the synthesized samples.
Figures S6 and
S7 present the XPS spectra for a survey scan of the samples with all peaks (including Ag 3d, In 3d, Zn 2p and S 2p) labeled. Those results indicate that we have successfully synthesized the AgInZnS QDs.
To investigate the performance of WLEDs based on CsPbBr3 QDs, we combined green emitting CsPbBr3 QDs and red emitting AgInZnS QDs on the blue emitting InGaN chips. Figure 6(a) and 6(b) illustrate the EL spectra of CsPbBr3-OA QDs WLEDs and CsPbBr3-DA QDs WLEDs at a driving voltages of 2.65 V, respectively. Three emission peaks at 450, 520 and 610 nm have been observed, which are related to blue InGaN chip, CsPbBr3 QDs and AgInZnS QDs, respectively. The CIE color coordinates of (0.32, 0.35) and (0.44, 0.42) corresponding to the CsPbBr3-OA QDs and CsPbBr3-DA QDs WLEDs, respectively, as shown in Fig. 6(c).
Figure 6.(a) PL spectrum of WLEDs based on CsPbBr3-OA QDs with a CRI of 82. (b) PL spectrum of WLEDs based on CsPbBr3-DA QDs with a CRI of 93 (The inset shows photographs of the devices without and with driving voltage). (c) CIE chromaticity diagram of both WLEDs.
As shown in Table 1, the characteristics of the fabricated WLEDs have been recorded, including CRI, CCT and CIE coordinates. The CCT (3018 K) of CsPbBr3-DA QDs WLEDs is lower than that of CsPbBr3-OA QDs WLEDs (6094 K). Notably, the CRI (93) and power efficiency (64.8 lm/W) of CsPbBr3-DA QDs WLEDs are much higher than those of CsPbBr3-OA QDs WLEDs (82 and 40.2 lm/W). It is evident that the CsPbBr3-DA QDs WLEDs exhibit better performance, which is attributed to the improved optical performance of the DA ligand modified CsPbBr3 QDs.
In
Figs. S8 and
S9, we have explored the behaviors of WLEDs with the increases of driving voltage. As the driving voltage increases from 2.5 to 2.62 V, the green-to-blue intensity ratio decreased by 45.1% for the CsPbBr3-OA QDs WLEDs, while it decreases by only 29% for the CsPbBr3-DA QDs WLEDs (see
Fig. S10). Comparing 2.5 V to an even higher operating voltage of 2.8 V, the decrease is 75.1% using the CsPbBr3-OA QDs and 65.1% using the CsPbBr3-DA QDs, implying that CsPbBr3-DA QDs demonstrate no obvious degradation.
Figs. S8(b), S9(b),
Tables S2 and
S3 show the color coordinates and CCT/CRI of WLEDs with the increase of driving voltages. To evaluate the performance of the prepared WLEDs, we focus on the main optical parameters of WLEDs using CsPbBr3 QDs on the blue chip, see Table 2 for details. Obviously, the CRI of warm WLEDs here shows the highest value than those of published reports. We conclude from our results (in
Figs. S8, S9, and
Tables S2, S3, 2) that the degradation of CsPbBr3-DA QDs is less than that for CsPbBr3-OA QDs under strong illumination. This suggests that ligand modified CsPbBr3-DA QDs have advantages over common CsPbBr3 QDs for green emitting application.
The thermal imaging photographs of the prepared WLEDs were measured under the different driven currents of 10 mA, 30 mA and 70 mA, as shown in Fig. 7. There is obvious temperature difference between CsPbBr3-OA QDs and CsPbBr3-DA QDs WLEDs at 10 mA driving current (see left insets in Fig. 7(a) and 7(b)). When driving current increases to 30 mA, the temperature of CsPbBr3-OA QDs WLEDs is 23.6 °C, while the CsPbBr3-DA QDs WLEDs exhibits a lower temperature of 21.2 °C (middle insets in Fig. 7(a) and 7(b)), i.e., the temperature of CsPbBr3-DA WLEDs is decreased by 2.4 °C under the same measurement condition. Notably, the right insets in Fig. 7(a) and 7(b) show the thermal imaging photographs CsPbBr3-OA QDs WLEDs with the temperature of 35.2 °C and CsPbBr3-DA QDs WLEDs with the temperature of 27 °C under the same driving current of 70 mA, respectively. In comparison with CsPbBr3-OA QDs WLEDs, the temperature of CsPbBr3-DA QDs WLEDs decreases by 8.2 °C. We can conclude that the thermal imaging photographs indicate that the CsPbBr3-DA QDs WLEDs exhibit better thermal performance than that of the CsPbBr3-OA QDs WLEDs. Two factors account for the decreasing temperature of the CsPbBr3-DA QDs WLEDs. For CsPbBr3-OA QDs, the nonradiation emission is much more serious than that of CsPbBr3-DA QDs, which was confirmed by their lifetime decay, as described above in Fig. 3(c). The second factor is the lower radiative efficiency of CsPbBr3-OA QDs, which means that some photoexcited electrons can recombine with holes nonradiatively through thermal emission. The measured PLQY of CsPbBr3-OA QDs is only 84%, while the PLQY of CsPbBr3-DA QDs is 96%. Therefore, there is an obviously increased non-radiative loss in the CsPbBr3-OA QDs, resulting in a high temperature in WLEDs.
Figure 7.The thermal imaging photographs of (a) CsPbBr3-OA QDs WLEDs and (b) CsPbBr3-DA QDs WLEDs with various driving current.
Conclusions
In summary, we successfully synthesized high performance and excellent stability of CsPbBr3 QDs by ligand modification. Compared with the regular CsPbBr3 QDs, a substantially improved stability of ligand modified CsPbBr3 QDs against ethanol and water was achieved. Further, the fabricated WLEDs by combining ligand modified CsPbBr3 QDs with red AgInZnS QDs on InGaN blue chips exhibit the excellent luminescent performance, including color coordinate of (0.44, 0.42), high color rendering index (CRI) of 93 and power efficiency of 64.8 lm/W. Moreover, the WLEDs based on the ligand modified CsPbBr3 QDs under high driving current demonstrate the better thermal performance than that of WLEDs using regular CsPbBr3 QDs. The excellent performances of WLEDs and facile approach used here will enrich the application of ligand modified CsPbBr3 QDs and demonstrate an effective way to prepare effective WLEDs.