Abstract
Slow light, a technology to control the optical signal by reducing the group velocity, has been widely studied to obtain enhanced nonlinearities and increased phase shifts owing to its promoting of the light–matter interaction ability. In this work, a wideband slow light is achieved in a simple one-dimensional fishbone grating waveguide. A flat band indicating slow light with a group index of 13 and bandwidth over 10 nm is obtained by the plane wave expansion calculation, and the corresponding experimental results agree well with the theoretical prediction. A step taper is designed to compensate the coupling loss. The proposed fishbone grating waveguide is a good candidate for wideband slow light devices in light communication.1. INTRODUCTION
Slow light technologies have attracted great research interest in the past decades because of their capability to delay and manipulate the speed of light, which has a significant influence on all optical communications and integrated optics [1]. The slowdown of light has been observed in a diverse range of media, including atomic vapors [2], optical fibers [3,4], micro-rings [5,6], and photonic crystal waveguides (PCWs) [7–11]. Among them, the slow light PCWs have exhibited significant advantages because of their ultracompact footprint, a moderately slow light loss, and a relatively small group velocity dispersion (GVD). Moreover, previous studies on PCWs have shown the unprecedented ability to increase the slow light bandwidth and eliminate the GVD effects such as lattice-shifted PCWs [12,13], slot PCWs [14], and PC-coupled cavity waveguides (CCWs) [15,16]. Despite these advantages, PCWs require rigorous periodicity in two dimensions, which adds complexity and difficulty to the fabrication. As a result, the fabrication process in PCWs is still a key issue that dominates slow light performance. For example, the roughness and imperfect locations of the holes during the fabrication process would cause serious slow light losses and signal distortion. Compared with PCWs, the one-dimensional (1D) silicon fishbone grating waveguide (FBGW) [17–21] attracts attention because, compared to PCWs, it is fabricated easier and exhibits similar slow light performance, but provides a much lower scattering loss. Due to the less etched surface area overlapped with the optical mode in the FBGW, it has been experimentally demonstrated that slow light in the FBGW has lower optical propagation loss and is less susceptible to fabrication variations [22]. Moreover, different from 2D PCWs, the lateral light confinement in 1D FBGWs relies on index confinement. Thus, its footprint could be further reduced, and therefore, it is more appealing for integrated optics.
Recently, a well-designed 1D FBGW was experimentally tested with a 100 ps delay and related small loss [18]; however, the obtained slow light was designed at the band edge, while the flatness in the band edge determines large dispersion, which may limit the corresponding slow light bandwidth. However, periodicity structures have an intrinsic advantage to increase the slow light bandwidth, as shown in the previous PCW literature [22,23]. For example, PCWs can move the slow light regime from the band edge to the middle band by appropriate band engineering, while the linearity in the middle band can result in wideband slow light. However, the situation is different for a grating structure such as a FBGW. First, there is only 1D periodicity in the FBGW; thus, the freedom for band engineering is quite limited if compared with the 2D PCW case. Second, for the FBGW, the lateral grating dimension is only several micrometers, and the band engineering at such a small dimension is extremely difficult and challenging for the present clean room fabrication technology. For this reason, wideband slow light in 1D grating structures has not been explored and experimentally verified.
In this work, a simple but effective 1D-grating-based fishbone-like slow light waveguide is proposed and experimentally verified with a large slow light bandwidth over 10 nm and a constant group index of approximately 13. To the best of our knowledge, the bandwidth is one magnitude larger than in other work [18,19,24]. The simple geometry in our wideband FBGW has the advantages of large fabrication tolerance and low intrinsic propagation loss. Moreover, a special slow light coupler has been designed and tested. Our designed wideband FBGW may pave the way for future wideband slow-light-grating devices.
2. NUMERICAL RESULTS AND DISCUSSION
The proposed FBGW is shown in Fig. 1(a), where a silicon layer is placed on the top of the silicon dioxide substrate. In the silicon layer, two symmetrical crosses are joined together to form a basic unit, as can be seen in the right panel of Fig. 1(a), and these basic units are periodically repeated along the waveguide direction to constitute the fishbone-like grating. In the basic unit, the period of the grating teeth is set to be 420 nm. The widths (, , ) for the upper, middle, and lower rectangles are , , and , respectively, while the lengths (, , ) are , , and , respectively. Figure 1(b) shows the scanning electron microscope (SEM) picture of the fabricated FBGW.
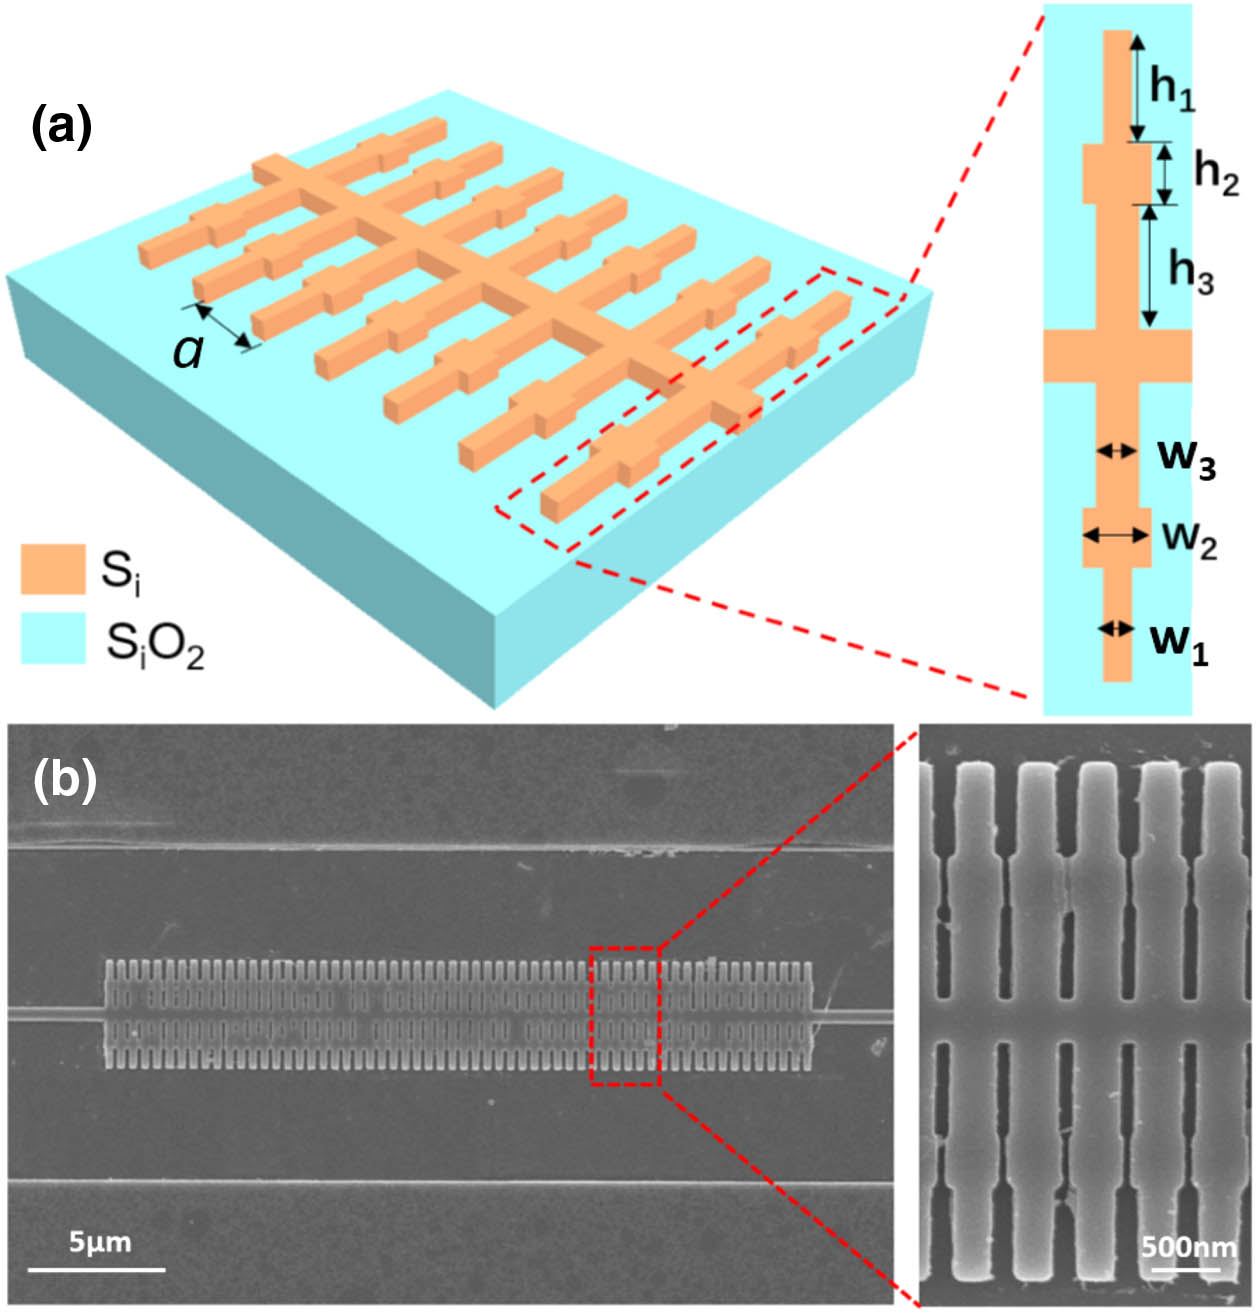
Figure 1.(a) Schematic picture of the proposed FBGW; (b) SEM picture of the top view of the FBGW. Insets show the amplified picture of the red rectangle area.
The device is fabricated on a silicon-on-insulator wafer with a 220-nm-thick top silicon layer and a 2 μm SiO2 buried oxide layer. The wafer is first coated with photoresist poly(methyl methacrylate) using a spin processor. The gratings, waveguides, and couplers are first patterned with the Raith150II E-beam lithography (EBL) system and then etched with inductively coupled plasma (ICP) in the first overlay. The second overlay is needed to etch the grating coupler, which is 150 nm high, different from the height of the FBGW (220 nm). The minimum feature size of the structure is approximately 60 nm, which matches the lithographic system’s requirement such as the EBL system.
To obtain the wideband slow light through the 1D periodicity of FBGW, the dispersion relationship of the proposed grating needs to be rigorously studied, since the ratio of the – curve determines the group index . The dispersion relationship between the frequency and wave vector is analyzed by the three-dimensional plane-wave-expansion (PWE) method using the Massachusetts Institute of Technology photonic bands software. The PWE method utilizes the periodicity of the structure, which simplifies band calculation as solving algebraic eigenvalues. The supercell is used for faster calculation in the propagation direction. The supercell’s structure is one period of the grating teeth, as shown in the right panel of Fig. 1(a). Systematic sweeps of the geometrical parameter influences on dispersion curves are performed in Fig. 2. As a starting point, we set the widths (, , ) for the upper, middle, and lower rectangles as , , and , respectively, while the lengths (, , ) are , , and , respectively. During the sweep, we increase one of the parameters while keeping others unchanged, and the dispersion curve behaviors are depicted in Figs. 2(a)–2(f). In Fig. 2, it can be seen that the dispersion curves move to lower frequencies when the geometrical parameter increases. This is expected because the increase of , , , , , and causes the increase of the corresponding effective index. In addition, the degree of the reduction and the reduced features of these curves in Figs. 2(a)–2(f) are different. In Fig. 2(a), the dispersion curves exhibit complex behavior when the height of the outer teeth is monotonously increased: the middle regions of the curves decrease significantly while increases; however, other regions (the initial part above the light line and the part close to the band edge) of the curve almost stay constant. This indicates has a pronounced influence on the middle region of the dispersion curve. In Figs. 2(d)–2(e), it can be seen that the initial regions of the curves above the light line reduce more rapidly than the regions of the curves close to the band edge, when the widths of the central teeth and the outer teeth increase. This suggests and have a dominant effect on the initial region of the dispersion curve. The situation is just the opposite in Fig. 2(f). When the width of the inner teeth increases in Fig. 2(f), the regions of the curves close to the band edge decreases more rapidly than the initial regions of the curves. This suggests that exerts a greater influence on the band edge regions. As a summary from Fig. 2, the height of the outer teeth is the most sensitive parameter to change the middle region of the dispersion curve, and the width of the inner teeth mainly affects the band edge region of the curve, while and are responsible for the influence on the initial part of the curve. These influences of geometrical parameters enable a more precise control of the band shape, especially because different parameters have different effects on the band curve.

Figure 2.Band variation with (a) (, , , , ); (b) (, , , , ); (c) (, , , , ); (d) (, , , , ); (e) (, , , , ); (f) (, , , , ).
With a full study of the dispersion relationship in Fig. 2, some approaches are taken to increase the slow light bandwidth. For previous studies, the slow light was generated near the band edge with limited bandwidth. The strategy here is to use the precise control of the dispersion curve to move the band edge slow light into the mid-band slow light. To achieve this, and are reduced to raise the initial part of the – curve, while is increased to lower the band edge. As a result, a twisted – curve is obtained. Using appropriate tune to optimize the middle region of the curve, a large linear middle region can be obtained in the – curve, as depicted in Fig. 3(a). The geometrical parameters depicted in Fig. 3(a) are the widths (, , ) , , and , and the lengths (, , ) , , and .
Figure 3.(a) Band diagram for the 1D fishbone grating waveguide; the inset pictures are the electric fields of A and B, respectively; (b) group index (for different flat band) versus the wavelength (red line: , , , , , ; blue line: , , , , , ; black line: , , , , , ).
As the ratio of the – curve determines the group index, the red circle curve in Fig. 3(b) records the group index variation versus the wavelength corresponding to the – curve in Fig. 3(a). It can be seen that this group index curve first increases monotonously, then stays constant over a certain bandwidth, and after that, it increases rapidly, which displays the characteristics of the “chair type” group index curve. The bandwidth here is defined as the frequency range where the group index variation is limited by 10% to its central value. One significant feature of the group index curve is that it has a constant group index over a bandwidth larger than 10 nm, which corresponds to the large linear portion of the – curve in Fig. 3(a). This indicates that wideband slow light has been obtained by the grating optimization. Furthermore, such a wideband feature is obtained by geometrical optimization, and thus, it can be highly tunable under different grating parameters. In Fig. 3(b), the group indices for different parameters are plotted. The group indices are approximately 13, 28, and 40, while the corresponding slow light bandwidths are 10 nm, 4 nm, and 1 nm, respectively. It can be concluded that there is a trade-off between the group index and slow light bandwidth: with the increase of group index, the bandwidth decreases. The bandwidth of the group index that is approximately 13 is two times larger than the bandwidth of the blue line with the group index of approximately 28 as shown in Fig. 3(b).
The electric field intensity distribution of the mode at different slow light regions is shown in the inset of Fig. 3(a). The introduction of lateral grating teeth helps push the mode field out of the central waveguide and enhances the Bragg reflection and scattering at the lateral corrugations, which is important to get a high group index and properly tune the dispersion. The mode field mainly located in the lateral grating teeth corresponds to the band edge slow light. From the dot B in the picture, the mode fields concentrated in the periodic teeth region on both sides and the central waveguide have equivalent magnitude, which means there is not much resonance in the structure, corresponding to the flat semi-slow light part. Compared with dot A, the mode field spreads more into the lateral grating teeth by field coupling when the wave vector value increases.
The fishbone grating waveguide’s slow light effect is verified through the 3D finite-difference time-domain method, as shown in Fig. 4. The length of the grating waveguide is set as , where is the period of the grating teeth. A Gaussian pulse with the central wavelength of 1610 nm and a bandwidth over 10 nm is input from the strip waveguide. Two monitors are located at the input and the output of the waveguide separately. The transmission spectrum is shown as the red line in Fig. 4(b). Figure 4(a) indicates the temporal pulse detected by the monitors. From the time distance between the input and the output pulse peaks, the time delay is calculated to be , and the group index of the optical pulse is determined to be , which matches the result of the plane-wave-expansion simulation very well. In addition, the full width at half-maximum (FWHM) of the output pulse (460 fs) does not change much compared to the incident one (400 fs), which means there is not much distortion. However, due to the mismatch and low coupling efficiency between the strip waveguide and the FBGW, the transmission is not higher than 20%, as depicted in Fig. 4(b).
Figure 4.(a) Temporal pulse detected at the input and the output; (b) simulated transmission of different periods, the inset is the SEM image of the step taper.
To improve the coupling efficiency, the step taper is introduced, as shown in the inset of Fig. 4(b). When the light speed changes drastically between the fast light and slow light, serious loss appears due to the mode speed mismatch. One possible solution is to design specific step tapers that operate at a faster light speed to compensate the strong speed mismatch between the fast light and slow light [20,25–27]. Thus, the hetero group velocity step taper is introduced into the structure, of which the group index is between for the strip waveguide and for FBGW. As shown in the inset of Fig. 4(b), two groups of tapers are set to compensate the coupling loss. The coupler is nearly the same structure as the fishbone grating waveguide. The value of the tapers is set to 425 nm and 431 nm, respectively. The group index decreases with the increase of the period value. The length of each cube does not change. From Ref. [21], the oscillation patterns will not be improved when the length of cuboids is not matched because the mode-matching condition may be destroyed. And the widths of the cuboids keep the same proportion of the period. To find a better coupling effect, the influence of the step taper’s period number is studied. Figure 4(b) shows the transmission of the slow light fishbone grating waveguide with different periods of step taper. The transmission has a peak when , which means is the optimized step taper length. As corresponds to butt coupling, it means the light propagates directly from the strip waveguide into the FBGW without taper. Comparing the transmission of the waveguide with () and without () the taper, the transmission reaches over 60%, which is greatly improved compared to the butt coupling.
3. EXPERIMENTAL RESULTS AND DISCUSSION
To experimentally demonstrate the wideband slow light effect, the waveguide was fabricated and tested. The experiment setup for the test of the FBGW performance is shown in Fig. 5(a). The input light is generated from a tunable laser source. Its polarization is controlled by a polarization controller to obtain the TE mode light, which is injected into the chip through a grating coupler with the coupling angle of 80°. The inset of Fig. 5(a) shows the SEM images of the fabricated grating coupler. The output temporal spectrum response is recorded and analyzed by an oscilloscope.
Figure 5.(a) Schematic of the experimental setup. Inset pictures are SEM images of the grating coupler. In addition, we utilize a tunable laser (TL) source, a polarization controller (PC), a data analyzer (DA), and an optical spectrum analyzer (OSA). (b) Measured transmission and group index as functions of wavelength; (c) group index (from both simulation and experiment) as a function of wavelength.
The ends of the grating form a Fabry–Perot cavity at the wavelengths above the stop band, leading to resonant ripples [24]. By studying the amplitude of the Fabry–Perot ripples, the calculated insertion loss is approximately 16 dB in the wideband slow light region. Using the Fabry–Perot effect, the output signal is controlled by the phase change at two sides of the slow light fishbone grating waveguide. From signal 1 to 0, the phase change is . and are the wavelengths corresponding to signal 1 and signal 0 in the transmission spectrum, respectively. The spectral dependence of the group index in the FBGW can then be deduced from positions of the adjacent peak and valley of the oscillations as where is the length of the waveguide, and is the group index of the 1D FBGW. The transmission spectrum was measured and is shown in Fig. 5(b), and the oscillation period decreases with the increase of wavelength. The group index then can be calculated from Eq. (1), and the group indices are drawn in the same diagram (red plots), where the group index increases from 5 to over 60, as the wavelength increases from 1550 to 1610 nm. Figure 5(c) shows the group index of simulation and experiment as a function of wavelength. From Fig. 5(c), the experimental data (red circles) agree well with the theoretical dispersion curve (black curve). A bandwidth over 10 nm with a high group index close to 12 can be clearly observed. The deviation between the measured and the calculated group indices mainly attributes to fabrication inaccuracies.
4. CONCLUSION
In summary, we have designed a slow light fishbone grating waveguide, which has a simple 1D structure and was experimentally verified on a silicon chip. In this work, the defect effect is taken into consideration, and a flat band away from the band edge is finally found in the grating structure. The proposed slow light waveguide’s minimum feature size is quite small due to the multi-teeth structure, which makes the fabrication difficult. But compared with PCWs, the FBWG will take much less fabrication time due to its simple structure and a small device size, and the fabrication in the EBL and ICP progress is more accurate because of its rectangular shape. The slow light FBGW is optimized and fabricated to obtain a large bandwidth with a high group index and low propagation loss. The bandwidth over 10 nm is one magnitude larger than that of other similar grating structure waveguides. The performance of our device is superior to other grating waveguides in terms of the trade-off between the group index and bandwidth. Thus, the slow light fishbone grating waveguide will have the advantage in future high-speed signal processing.
References
[1] R. W. Boyd. Slow and fast light: fundamentals and applications. J. Mod. Opt., 56, 1908-1915(2009).
[2] D. F. Phillips, A. Fleischhauer, A. Mair, R. L. Walsworth, M. D. Lukin. Storage of light in atomic vapor. Phys. Rev. Lett., 86, 783-786(2001).
[3] M. G. Herraez, K. Y. Song, L. Thevenaz. Broad-bandwidth Brillouin slow light in optical fibers. Optical Fiber Communication Conference and the National Fiber Optic Engineers Conference, OTuA2(2006).
[4] Y. Okawachi, M. S. Bigelow, J. E. Sharping, Z. Zhu, A. Schweinsberg, D. J. Gauthier, R. W. Boyd, A. L. Gaeta. Tunable all-optical delays via Brillouin slow light in an optical fiber. Phys. Rev. Lett., 94, 511-513(2005).
[5] F. Xia, L. Sekaric, Y. A. Vlasov. Ultracompact optical buffers on a silicon chip. Nat. Photonics, 1, 65-71(2007).
[6] W. Bogaerts, P. De Heyn, T. Van Vaerenbergh, K. De Vos, S. K. Selvaraja, T. Claes, P. Bienstman, D. Van Thourhout, R. Baets. Silicon microring resonators. Laser Photon. Rev., 6, 47-73(2012).
[7] T. Baba. Slow light in photonic crystals. Nat. Photonics, 2, 465-473(2008).
[8] Y. A. Vlasov, M. O’Boyle, H. F. Hamann, S. J. McNab. Active control of slow light on a chip with photonic crystal waveguides. Nature, 438, 65-69(2005).
[9] R. Hao, E. Cassan, X. Le Roux, D. Gao, L. Vivien, D. Marris-Morini, X. L. Zhang. Improvement of delay-bandwidth product in photonic crystal slow-light waveguide. Opt. Express, 18, 16309-16319(2010).
[10] R. Hao, E. Cassan, H. Kurt, X. Le Roux, D. Marris-Morini, L. Vivien, H. M. Wu, Z. P. Zhou, X. L. Zhang. Novel slow light waveguide with controllable delay-bandwidth product and ultra-low dispersion. Opt. Express, 18, 5942-5950(2010).
[11] R. Hao, X. L. Peng, E. P. Li, Y. Xu, J. M. Jin, X. M. Zhang. Improved slow light capacity in graphene-based waveguide. Sci. Rep., 5, 15335(2015).
[12] T. Tamura, K. Kondo, Y. Terada, Y. Hinakura, N. Ishikura, T. Baba. Silica-clad silicon photonic crystal waveguides for wideband dispersion-free slow light. J. Lightwave Technol., 33, 3034-3040(2015).
[13] Y. Terada, K. Miyasaka, K. Kondo, N. Ishikura, T. Tamura, T. Baba. Optimized optical coupling to silica-clad photonic crystal waveguides. Opt. Lett., 42, 4695-4698(2017).
[14] S. Serna, P. Colman, W. Zhang, X. L. Roux, C. Caer, L. Vivien, E. Cassan. Experimental GVD engineering in slow light slot photonic crystal waveguides. Sci. Rep., 6, 26956(2016).
[15] E. Kuramochi, N. Matsuda, K. Nozaki, A. H. K. Park, H. Takesue, M. Notomi. Wideband slow short-pulse propagation in one-thousand slantingly coupled L3 photonic crystal nanocavities. Opt. Express, 26, 9552-9564(2018).
[16] Y. Lai, M. S. Mohamed, B. Gao, M. Minkov, R. W. Boyd, V. Savona, R. Houdre, A. Badolato. Ultra-wide-band structural slow light. Sci. Rep., 8, 14811(2018).
[17] Y. Ma, B. Dong, B. Li, J. Wei, Y. Chang, C. P. Ho, C. Lee. Mid-infrared slow light engineering and tuning in 1-D grating waveguide. IEEE J. Sel. Top. Quantum Electron., 24, 6101608(2018).
[18] C. J. Chung, X. Xu, G. Wang, Z. Pan, R. T. Chen. On-chip optical true time delay lines featuring one-dimensional fishbone photonic crystal waveguide. Appl. Phys. Lett., 112, 071104(2018).
[19] H. Yan, X. Xu, C. J. Chung, H. Subbaraman, Z. Pan, S. Chakravarty, R. T. Chen. Silicon-organic hybrid electro-optic modulator based on one-dimensional photonic crystal slot waveguides. Conference on Lasers and Electro-Optics (CLEO), SF1E.6(2016).
[20] C. Bao, J. Hou, H. Wu, E. Cassan, L. Chen, D. Gao, X. Zhang. Flat band slow light with high coupling efficiency in one-dimensional grating waveguides. IEEE Photon. Technol. Lett., 24, 7-9(2012).
[21] X. Zhao, H. Dalir, X. Xu, R. T. Chen. Efficient coupling into slow-light one-dimensional fishbone waveguide by mode converter method. Appl. Phys. Express, 10, 072502(2017).
[22] S. Kubo, D. Mori, T. Baba. Low-group-velocity and low-dispersion slow light in photonic crystal waveguides. Opt. Lett., 32, 2981-2983(2007).
[23] J. Liang, L. Y. Ren, M. J. Yun, X. Han, X. J. Wang. Wideband ultraflat slow light with large group index in a W1 photonic crystal waveguide. J. Appl. Phys., 110, 063103(2011).
[24] Z. Zou, L. Zhou, X. Li, J. Chen. 60-nm-thick basic photonic components and Bragg gratings on the silicon-on-insulator platform. Opt. Express, 23, 20784-20795(2015).
[25] M. Povinelli, S. Johnson, J. Joannopoulos. Slow-light, band-edge waveguides for tunable time delays. Opt. Express, 13, 7145-7159(2005).
[26] D. Marris-Morini, E. Cassan, L. Vivien. Ultracompact tapers for light coupling into two-dimensional slab photonic-crystal waveguides in the slow light regime. Opt. Eng., 47, 014602(2008).
[27] A. Hosseini, X. Xu, D. N. Kwong, H. Subbaraman, W. Jiang, R. T. Chen. On the role of evanescent modes and group index tapering in slow light photonic crystal waveguide coupling efficiency. Appl. Phys. Lett., 98, 031107(2011).


