 nm
nm 2.5% RMS
 1% RMS
 25 ps RMS
 ,
, )
)
 DL (
DL (
 )
) DL (
DL (
 )
) rad
rad rad
rad 4% RMS
Paul Mason, Saumyabrata Banerjee, Jodie Smith, Thomas Butcher, Jonathan Phillips, Hauke Höppner, Dominik Möller, Klaus Ertel, Mariastefania De Vido, Ian Hollingham, Andrew Norton, Stephanie Tomlinson, Tinesimba Zata, Jorge Suarez Merchan, Chris Hooker, Mike Tyldesley, Toma Toncian, Cristina Hernandez-Gomez, Chris Edwards, John Collier, "Development of a 100 J, 10 Hz laser for compression experiments at the High Energy Density instrument at the European XFEL," High Power Laser Sci. Eng. 6, 04000e65 (2018)
- High Power Laser Science and Engineering
- Vol. 6, Issue 4, 04000e65 (2018)
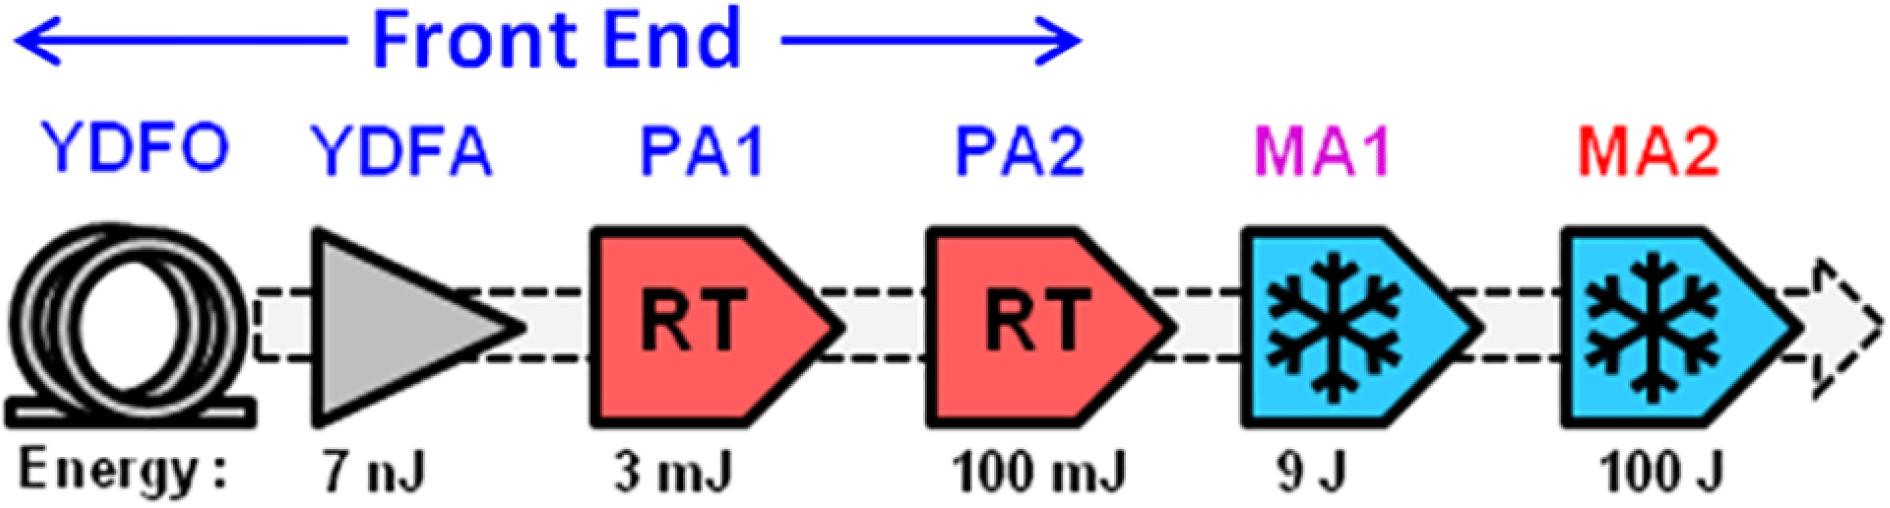
Fig. 1. Schematic of DiPOLE100X amplifier chain, showing typical output energy at each amplifier stage: YDFO
 Yb–silica fibre oscillator; YDFA
 Yb–silica fibre amplifier (inc. temporal pulse shaping); PA
 room-temperature preamplifier (1
 Yb:CaF
2
regenerative, 2
Yb:CaF
2
regenerative, 2
 Yb:YAG multi-pass); MA
 main cryogenic amplifier (ceramic Yb:YAG multi-slab).
Yb–silica fibre oscillator; YDFA
Yb–silica fibre amplifier (inc. temporal pulse shaping); PA
room-temperature preamplifier (1
Yb:CaF
2
regenerative, 2
Yb:YAG multi-pass); MA
main cryogenic amplifier (ceramic Yb:YAG multi-slab). 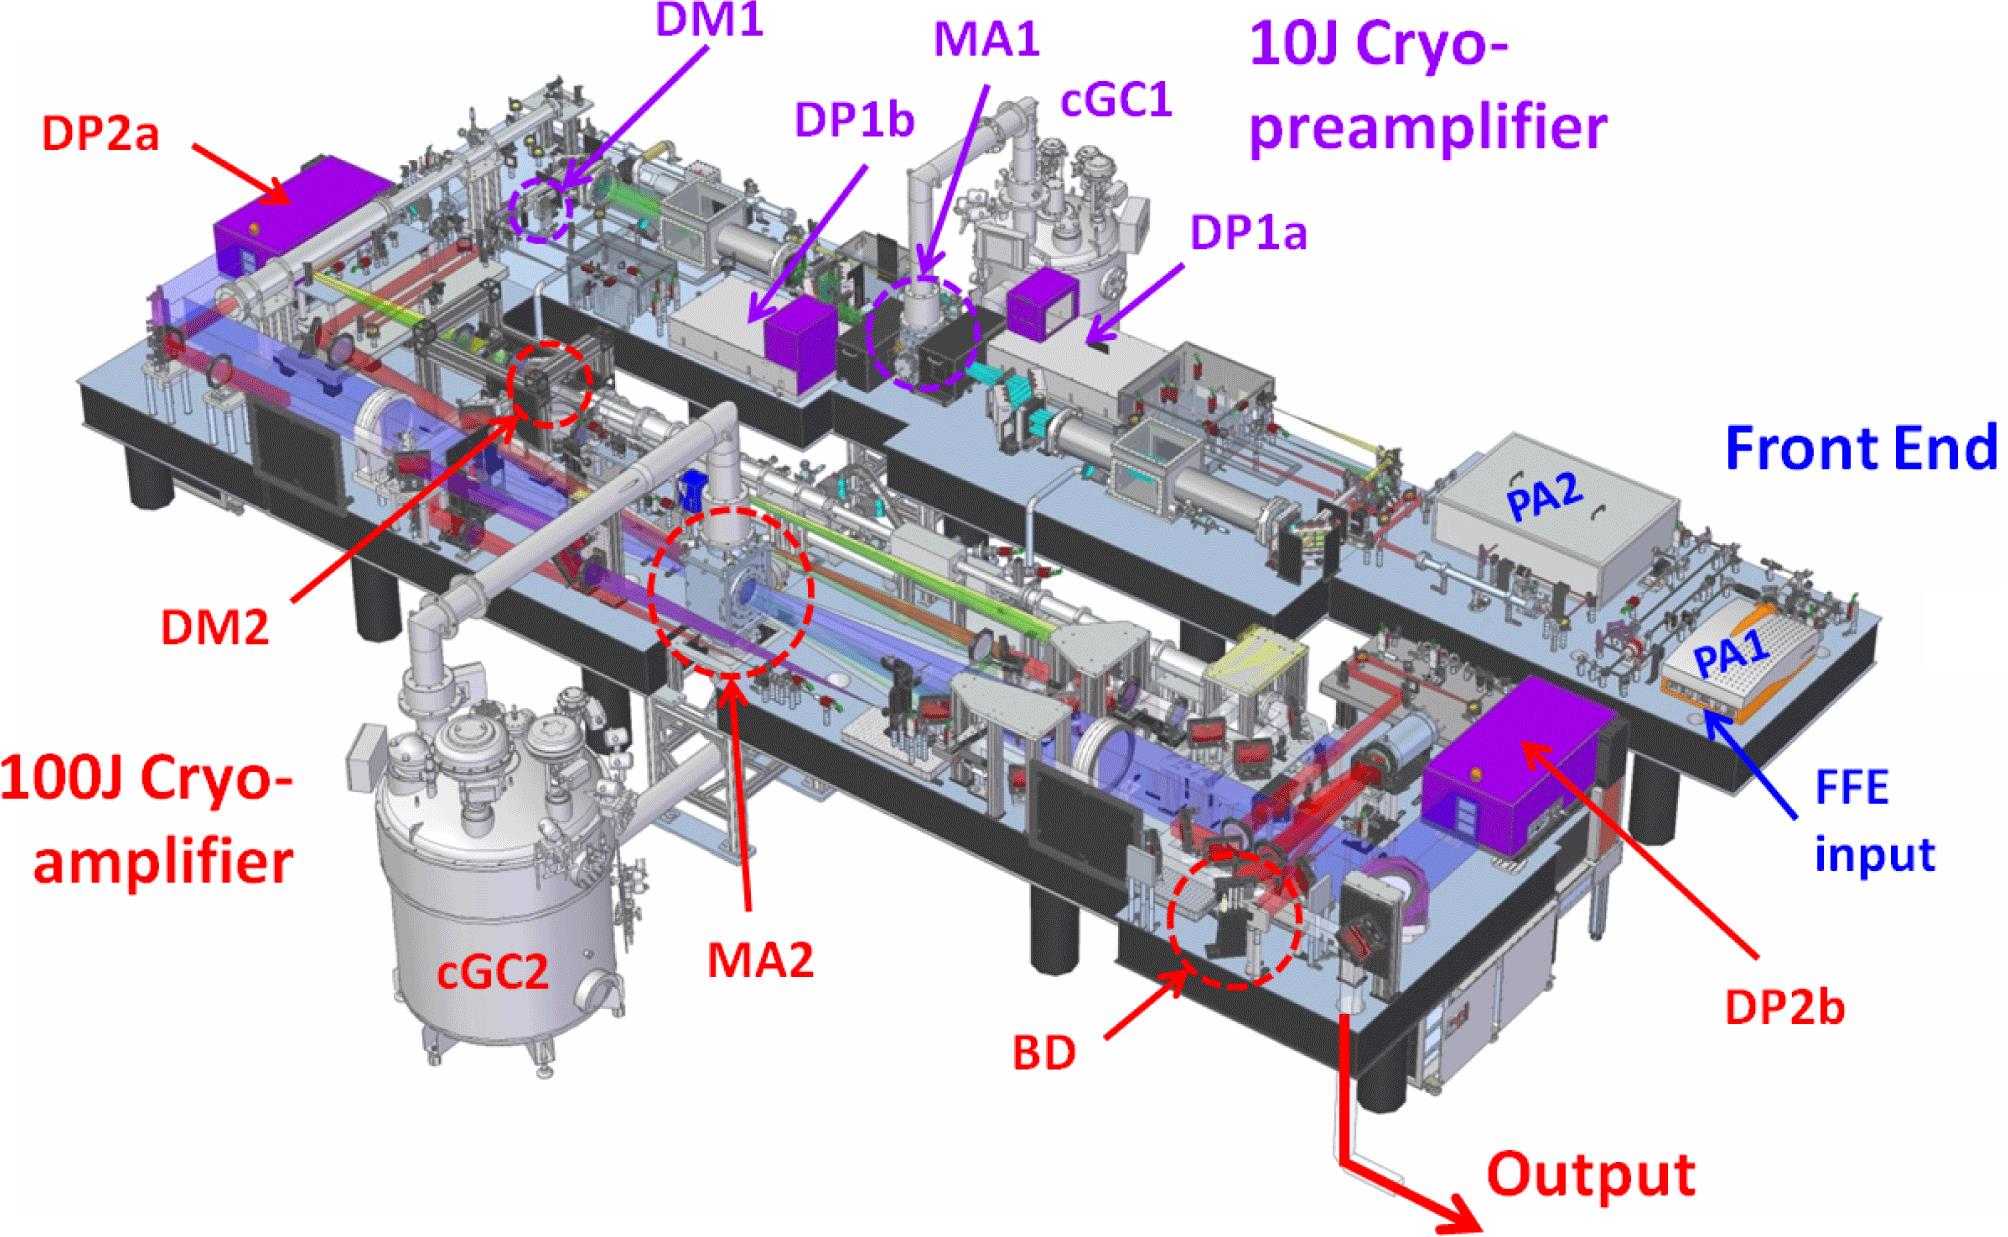
Fig. 2. 3D model of DiPOLE100X: FFE
 fibre front end, DP
 diode pumps, cGC
 cryogenic gas coolers, DM
 deformable mirrors, BD
 beam diverter, FFE
 fibre front end (not shown).
fibre front end, DP
diode pumps, cGC
cryogenic gas coolers, DM
deformable mirrors, BD
beam diverter, FFE
fibre front end (not shown). Fig. 3. Schematic layout of the front end for DiPOLE100X.
Fig. 4. X-ray pulse timing diagram for SASE II beamline.
Fig. 5. DiPOLE100X timing diagram.
Fig. 6. Schematic showing 7-pass angularly multiplexed extraction architecture of the 10 J cryo-preamplifier. DP
 diode pumps, DM1
 10 J deformable mirror, BS
 beam splitters.
diode pumps, DM1
10 J deformable mirror, BS
beam splitters. Fig. 7. (a) Photograph of the DiPOLE100X 10 J bimorph deformable mirror, built at the CLF, with inset showing schematic of electrode pattern, (b) corrected output wave front and (c) far-field CCD camera image measured at 10 J, 10 Hz on the DiPOLE prototype amplifier.
Fig. 8. Energy stability over half an hour with inset showing measured temporal pulse shape for amplification of 2.2 ns pulses at 8 J, 10 Hz.
Fig. 9. Schematic showing 4-pass, off-axis, angularly multiplexed extraction architecture of the 100 J cryo-amplifier. DP
 diode pumps, DM2
 100 J deformable mirror, BD
 beam diverter.
diode pumps, DM2
100 J deformable mirror, BD
beam diverter. Fig. 10. (a) Photograph of new 100 J deformable mirror, (b) target aberrated wave front and (c) residual error in generated wave front.
Fig. 11. Synoptic screen for control and monitoring of 10 J cryo-preamplifier. Red lines correspond to the main 1030 nm laser beam path, input from the FE (left) and output to the beam transport section (right); blue lines represent diagnostic beam paths; and orange lines correspond to 940 nm pump diode beam paths.
Fig. 12. Temporal pulse shaping results at 6.5 J, 10 Hz obtained using the DiPOLE prototype amplifier (a) flat-top and (b) multi-step pyramid pulse profiles.
Fig. 13. Time lapse photographs of DiPOLE100X build with 3D CAD view of completed system.
Fig. 14. Schematic showing the main components of the HED instrument.
Fig. 15. Layout of DiPOLE100X in laser hutch at the HED instrument.
|
Table 1. Target parameters for DiPOLE100X and demonstrated performance
|
Table 2. Functionality of user control screens in DiPOLE100X control system


Set citation alerts for the article
Please enter your email address

© Copyright 2018-2021 | Chinese Laser Press. All Rights Reserved 沪ICP备15018463号-20