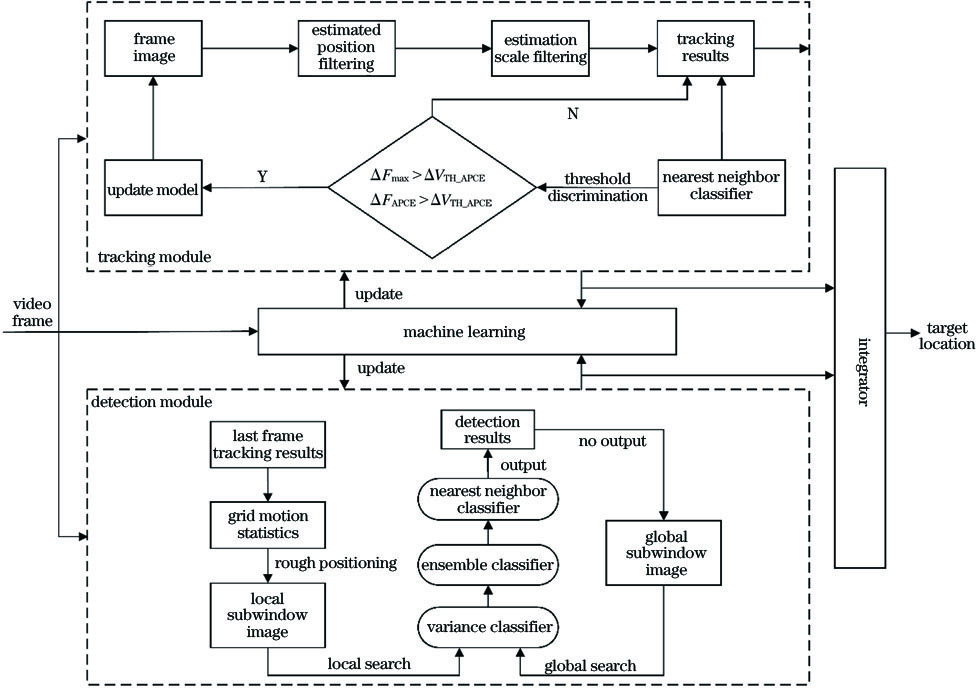
Fig. 1. Schematic of overall frame
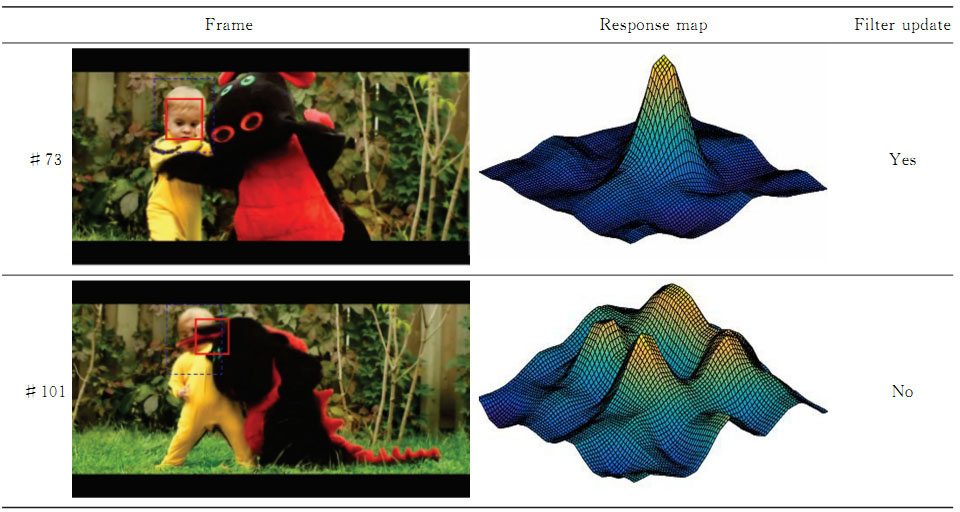
Fig. 2. Response maps and filter updates of DragonBaby sequence in different frames
Fig. 3. Gird motion partition effect diagram
Fig. 4. GMS detector detection effect diagram
Fig. 5. Tracking effects of different algorithms on partial sequences. (a)Basketball; (b)BlurOwl; (c)Football; (d)Freeman4; (e)Human4; (f)Liquor; (g)Skating2-2; (h)Soccer
Fig. 6. Precision and success rate curves of different tracking algorithms. (a) Precision; (b) Success rate
Fig. 7. Comparison of tracking precision under partial challenge environment. (a)Scale variation; (b)fast motion
Fig. 8. Comparison of success rate under partial challenge environment. (a)Occlusion; (b) scale variation
Video sequence | Frame | Challenge factor |
---|
Basketball | 725 | OCC、DEF、IV | BlurOwl | 631 | MB、FM、IPR、SV | Football | 362 | OCC、BC、IPR、OPR | Freeman4 | 283 | SV、OCC、BC、IPR、OPR | Human4Liquor | 6671741 | IV、OCC、SV、DEFIV、SV、OCC、MB、FM、OPR、OV、BC | Skating2-2 | 473 | SV、OCC、DEF、FM、OPR | Soccer | 392 | SV、IV、BC、FM、OCC、MB、IPR、OPR |
|
Table 1. Information of the test video sequences
Challenge | Ours | KCF | fDSST | SRDCF | Staple | TLD |
---|
IV | 0.788 | 0.724 | 0.720 | 0.781 | 0.778 | 0.515 | OV | 0.726 | 0.501 | 0.480 | 0.732 | 0.668 | 0.349 | SV | 0.797 | 0.631 | 0.649 | 0.738 | 0.721 | 0.498 | OCC | 0.800 | 0.632 | 0.602 | 0.724 | 0.727 | 0.515 | BC | 0.739 | 0.744 | 0.695 | 0.745 | 0.741 | 0.544 | MB | 0.793 | 0.601 | 0.570 | 0.767 | 0.699 | 0.547 | FM | 0.816 | 0.621 | 0.575 | 0.769 | 0.710 | 0.546 | DEF | 0.746 | 0.619 | 0.560 | 0.730 | 0.747 | 0.490 | LR | 0.849 | 0.560 | 0.602 | 0.663 | 0.610 | 0.538 | IPR | 0.746 | 0.685 | 0.696 | 0.730 | 0.755 | 0.550 | OPR | 0.799 | 0.663 | 0.651 | 0.731 | 0.726 | 0.507 |
|
Table 2. Track precision comparison of different algorithms under 11 challenging environments
Challenge | Ours | KCF | fDSST | SRDCF | Staple | TLD |
---|
IV | 0.752 | 0.550 | 0.651 | 0.735 | 0.715 | 0.435 | OV | 0.514 | 0.457 | 0.443 | 0.558 | 0.548 | 0.311 | SV | 0.717 | 0.417 | 0.548 | 0.664 | 0.607 | 0.371 | OCC | 0.743 | 0.512 | 0.538 | 0.674 | 0.653 | 0.429 | BC | 0.794 | 0.597 | 0.619 | 0.711 | 0.679 | 0.465 | MB | 0.729 | 0.550 | 0.553 | 0.759 | 0.650 | 0.530 | FM | 0.759 | 0.526 | 0.538 | 0.717 | 0.645 | 0.506 | DEF | 0.714 | 0.503 | 0.505 | 0.659 | 0.656 | 0.415 | LR | 0.623 | 0.295 | 0.644 | 0.625 | 0.472 | 0.319 | IPR | 0.664 | 0.541 | 0.659 | 0.659 | 0.663 | 0.471 | OPR | 0.636 | 0.516 | 0.569 | 0.619 | 0.662 | 0.417 |
|
Table 3. Success rate comparison of different algorithms under 11 challenge environments
Video sequence | Ours | KCF | fDSST | SRDCF | Staple | TLD |
---|
Basketball | 25.706 | 18.562 | 12.019 | 24.563 | 19.563 | 14.145 | BlurOwl | 19.598 | 22.440 | 17.212 | 25.309 | 23.764 | 11.908 | Football | 24.248 | 19.957 | 15.665 | 22.862 | 21.771 | 12.557 | Freeman4 | 41.393 | 29.849 | 30.702 | 37.423 | 39.878 | 16.312 | Human4Liquor | 17.46930.196 | 13.25921.573 | 10.58922.620 | 19.13426.987 | 16.18025.109 | 9.10217.445 | Skating2-2 | 21.281 | 20.056 | 17.225 | 21.565 | 22.323 | 13.608 | Soccer | 26.640 | 15.422 | 11.874 | 17.211 | 19.797 | 10.794 |
|
Table 4. Average tracking speed of different algorithms on video sequencesunit:frame/s