• Matter and Radiation at Extremes
  • Vol. 5, Issue 5, 055201 (2020)
R. Gonzalez-Arrabala), A. Rivera, and J. M. Perlado
Author Affiliations
  • Instituto de Fusión Nuclear Guillermo Velarde y Departamento de Ingeniería Energética, ETSII Universidad Politécnica de Madrid, E-28006 Madrid, Spain
  • show less
    DOI: 10.1063/5.0010954 Cite this Article
    R. Gonzalez-Arrabal, A. Rivera, J. M. Perlado. Limitations for tungsten as plasma facing material in the diverse scenarios of the European inertial confinement fusion facility HiPER: Current status and new approaches[J]. Matter and Radiation at Extremes, 2020, 5(5): 055201 Copy Citation Text show less
    (a) Layout of the HiPER reactor. Reprinted with permission from J. M. Perlado et al., Proc. SPIE 8080, 80801Z (2011).18 Copyright 2011 SPIE Digital Library. (b) Schematic view of the chamber designed for the HiPER Prototype and Demo scenarios.
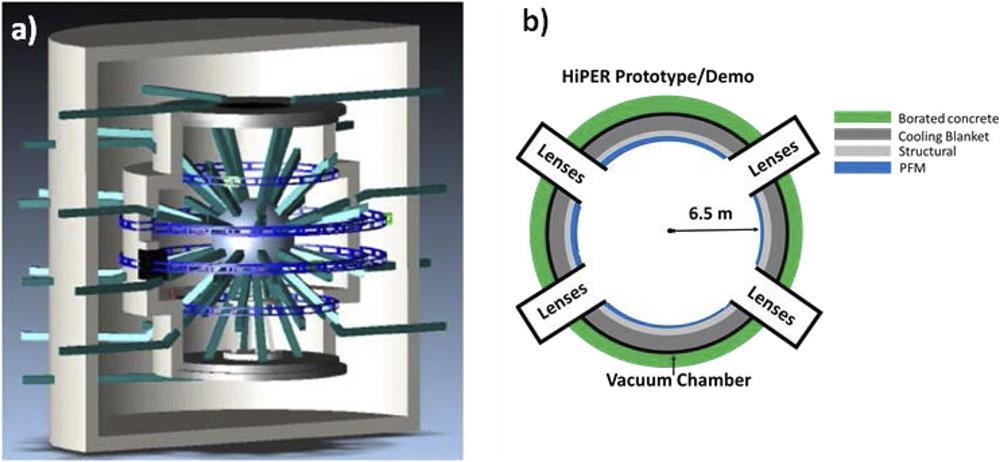
    Fig. 1. (a) Layout of the HiPER reactor. Reprinted with permission from J. M. Perlado et al., Proc. SPIE 8080, 80801Z (2011).18 Copyright 2011 SPIE Digital Library. (b) Schematic view of the chamber designed for the HiPER Prototype and Demo scenarios.
    Schematic overview of the most significant species produced in the explosion, together with their time of flight (TOF) and the depth at which they deposit most of their energy.
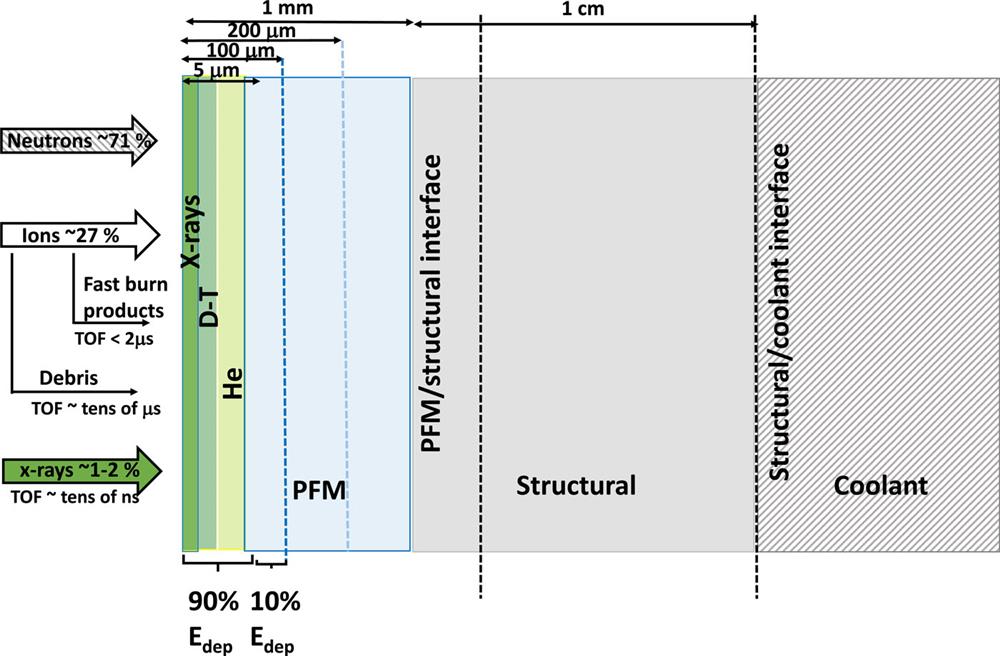
    Fig. 2. Schematic overview of the most significant species produced in the explosion, together with their time of flight (TOF) and the depth at which they deposit most of their energy.
    Heat flux factor (FHF) calculated for the different HiPER scenarios: Experimental (green dot), Prototype (yellow dot), and Demo (red dot). For comparison, FHF values reported by Linke et al.75 and Renk et al.76 for surface modifications are also plotted (blue dots): roughening (R), cracking (C), melting (M), and boiling (B).
    Fig. 3. Heat flux factor (FHF) calculated for the different HiPER scenarios: Experimental (green dot), Prototype (yellow dot), and Demo (red dot). For comparison, FHF values reported by Linke et al.75 and Renk et al.76 for surface modifications are also plotted (blue dots): roughening (R), cracking (C), melting (M), and boiling (B).
    Temperature of W as a function of time at different depths within the PFM for (a) HiPER Experimental scenario (first pulse), (b) HiPER Prototype scenario (steady state), and (c) HiPER Demo scenario (steady state). The steady state was reached ∼6 s and ∼60 s after the beginning of operation for HiPER Prototype and Demo scenarios, respectively. Reprinted with permission from Garoz et al., Nucl. Fusion 56, 126014 (2016). Copyright 2016 IOP Sciences.
    Fig. 4. Temperature of W as a function of time at different depths within the PFM for (a) HiPER Experimental scenario (first pulse), (b) HiPER Prototype scenario (steady state), and (c) HiPER Demo scenario (steady state). The steady state was reached ∼6 s and ∼60 s after the beginning of operation for HiPER Prototype and Demo scenarios, respectively. Reprinted with permission from Garoz et al., Nucl. Fusion 56, 126014 (2016). Copyright 2016 IOP Sciences.
    Maximum temperature calculated at the W surface and the maximum steady-state temperature. For comparison, the recrystallization and melting temperatures for W are indicated with dashed lines.
    Fig. 5. Maximum temperature calculated at the W surface and the maximum steady-state temperature. For comparison, the recrystallization and melting temperatures for W are indicated with dashed lines.
    Transverse stress (left) and axial strain (right) in W as a function of time for different depths. (a) HiPER Experimental scenario (first pulse). (b) HiPER Prototype scenario (steady state). (c) HiPER Demo scenario (steady state). Reprinted with permission from Garoz et al., Nucl. Fusion 56, 126014 (2016). Copyright 2016 IOP Sciences.
    Fig. 6. Transverse stress (left) and axial strain (right) in W as a function of time for different depths. (a) HiPER Experimental scenario (first pulse). (b) HiPER Prototype scenario (steady state). (c) HiPER Demo scenario (steady state). Reprinted with permission from Garoz et al., Nucl. Fusion 56, 126014 (2016). Copyright 2016 IOP Sciences.
    Scanning electron microscopy images of the surface of a W sample after exposure to 1600 pulses of (a) a nitrogen beam and (b) a helium beam. Reprinted with permission from Renk et al., Fusion Sci. Technol. 61, 57–80 (2012). Copyright 2012 Taylor and Francis the American Nuclear Society (http://www.asn.org/).
    Fig. 7. Scanning electron microscopy images of the surface of a W sample after exposure to 1600 pulses of (a) a nitrogen beam and (b) a helium beam. Reprinted with permission from Renk et al., Fusion Sci. Technol. 61, 57–80 (2012). Copyright 2012 Taylor and Francis the American Nuclear Society (http://www.asn.org/).
    [(a)–(c)] Ratio of He retained to total implanted He for W samples irradiated with He at 3 keV under different conditions: (a) Continuous irradiation at a dose rate of 2 × 1012 cm−2 s−1. (b) Pulsed irradiation, with 2 × 1012 cm−2 per pulse at a repetition rate of 1 Hz. (c) Comparison of continuous and pulsed irradiation at 1300 K and for different fluxes. In all cases, the number of He ions per cm2 averaged over 1 s is the same (2 × 1012 cm−2 or 2 × 1013 cm−2). [(d)–(f)] Fraction of He retained in trapping sites for W samples irradiated with He at 3 keV under different conditions. (d) Pulsed irradiation at 700 K, with 2 × 1013 cm−2 per pulse at a repetition rate of 1 Hz. (e) Pulsed irradiation at 1300 K, with 2 × 1013 cm−2 per pulse at a repetition rate of 1 Hz. (f) Continuous irradiation at a dose rate of 2 × 1013 cm−2 s−1. Reprinted with permission from Rivera et al., Nucl. Instrum. Methods Phys. Res., Sect. B 303, 81–83 (2013). Copyright 2013 Elsevier.
    Fig. 8. [(a)–(c)] Ratio of He retained to total implanted He for W samples irradiated with He at 3 keV under different conditions: (a) Continuous irradiation at a dose rate of 2 × 1012 cm−2 s−1. (b) Pulsed irradiation, with 2 × 1012 cm−2 per pulse at a repetition rate of 1 Hz. (c) Comparison of continuous and pulsed irradiation at 1300 K and for different fluxes. In all cases, the number of He ions per cm2 averaged over 1 s is the same (2 × 1012 cm−2 or 2 × 1013 cm−2). [(d)–(f)] Fraction of He retained in trapping sites for W samples irradiated with He at 3 keV under different conditions. (d) Pulsed irradiation at 700 K, with 2 × 1013 cm−2 per pulse at a repetition rate of 1 Hz. (e) Pulsed irradiation at 1300 K, with 2 × 1013 cm−2 per pulse at a repetition rate of 1 Hz. (f) Continuous irradiation at a dose rate of 2 × 1013 cm−2 s−1. Reprinted with permission from Rivera et al., Nucl. Instrum. Methods Phys. Res., Sect. B 303, 81–83 (2013). Copyright 2013 Elsevier.
    Top view (a) and cross-sectional (b) scanning electron microscopy images of pure α-phase nanostructured W coatings deposited by sputtering at the Instituto de Fusión Nuclear Guillermo Velarde following the procedure described in Ref. 152. The coating is made of columns with an average diameter of ∼100 nm, which grow perpendicular to the substrate.
    Fig. 9. Top view (a) and cross-sectional (b) scanning electron microscopy images of pure α-phase nanostructured W coatings deposited by sputtering at the Instituto de Fusión Nuclear Guillermo Velarde following the procedure described in Ref. 152. The coating is made of columns with an average diameter of ∼100 nm, which grow perpendicular to the substrate.
    Depth distribution of vacancies for nanostructured (NW) and monocrystalline (MW) W samples sequentially irradiated in continuous mode at room temperature by C and H ions at energies of 665 keV and 170 keV, respectively, as calculated by the Object Kinetic Monte Carlo (OKMC) code MMonCa at 300 K (black), and after annealing for 30 min at 473 K (green) or at 573 K (blue). Data taken from Ref. 113.
    Fig. 10. Depth distribution of vacancies for nanostructured (NW) and monocrystalline (MW) W samples sequentially irradiated in continuous mode at room temperature by C and H ions at energies of 665 keV and 170 keV, respectively, as calculated by the Object Kinetic Monte Carlo (OKMC) code MMonCa at 300 K (black), and after annealing for 30 min at 473 K (green) or at 573 K (blue). Data taken from Ref. 113.
    Implantation profiles of H calculated by the SRIM code for unannealed W: (a) nanostructured and (e) monocrystalline. Experimental (measured) and MMonCa simulated (calculated) depth profiles of H and vacancies for nanostructured W (left) and monocrystalline W (right) samples irradiated in continuous mode sequentially by high-energy C and H ions (665 keV and 170 keV, respectively) both at room temperature and at a fluence of 5 × 10 20 m−2: [(b) and (f)] unannealed, [(c) and (g)] after annealing for 30 min at 473 K, and [(d) and (h)] after annealing for 30 min at 573 K. The shaded region between 0 nm and 150 nm is not considered in the analysis because it is highly influenced by surface contamination. Data taken from Ref. 113.
    Fig. 11. Implantation profiles of H calculated by the SRIM code for unannealed W: (a) nanostructured and (e) monocrystalline. Experimental (measured) and MMonCa simulated (calculated) depth profiles of H and vacancies for nanostructured W (left) and monocrystalline W (right) samples irradiated in continuous mode sequentially by high-energy C and H ions (665 keV and 170 keV, respectively) both at room temperature and at a fluence of 5 × 10 20 m−2: [(b) and (f)] unannealed, [(c) and (g)] after annealing for 30 min at 473 K, and [(d) and (h)] after annealing for 30 min at 573 K. The shaded region between 0 nm and 150 nm is not considered in the analysis because it is highly influenced by surface contamination. Data taken from Ref. 113.
    Cross-sectional transmission electron micrographs of a section of (a) a Mo-coated W needle (a) unirradiated, (b) exposed to 1600 He pulses. (c) Scanning electron microscopy image of a Mo-coated W needle after exposure to 1200 He pulses in RHEPP-1. Reprinted with permission from Renk et al., Fusion Sci. Technol. 61, 57–80 (2012). Copyright 2012 Taylor and Francis the American Nuclear Society (http://www.asn.org/).
    Fig. 12. Cross-sectional transmission electron micrographs of a section of (a) a Mo-coated W needle (a) unirradiated, (b) exposed to 1600 He pulses. (c) Scanning electron microscopy image of a Mo-coated W needle after exposure to 1200 He pulses in RHEPP-1. Reprinted with permission from Renk et al., Fusion Sci. Technol. 61, 57–80 (2012). Copyright 2012 Taylor and Francis the American Nuclear Society (http://www.asn.org/).
    Nano-turf-coated tungsten foam. (a) 50×, (b) 200×, and (c) 2500× magnification. The ligaments are coated with single tungsten crystals and have characteristic lengths scales of the order of 5 µm. Reprinted with permission from Sharafat et al., J. Nucl. Mater. 347, 217–243 (2005). Copyright 2005 Elsevier.
    Fig. 13. Nano-turf-coated tungsten foam. (a) 50×, (b) 200×, and (c) 2500× magnification. The ligaments are coated with single tungsten crystals and have characteristic lengths scales of the order of 5 µm. Reprinted with permission from Sharafat et al., J. Nucl. Mater. 347, 217–243 (2005). Copyright 2005 Elsevier.
    ExperimentalPrototypeDemo
    FrequencyFew shots per bunch1 Hz10 Hz
    Shot energy (MJ)2050154
    Inner chamber radius (m)56.56.5
    BlanketNoYesYes
    Total energy fluence of ions (J m−2)1.7 × 1042.5 × 1047.7 × 104
    Heat flux factor, FHF (MW m−2 s0.5)9.714.444.4
    Maximum pulse temperature (K)87514103400
    Maximum steady-state temperature (K)610934
    Plastic region (×10−6 m)510100
    Plastic strain range reached during the cycle load (Δεp)4.5 × 10⁻³∼10−2∼6 × 10⁻²
    Allowed number of shots (based on purely thermomechanical considerations)270 × 1095 × 1071 × 106
    Lifetime based on thermomechanical considerations (hours)Not applicable14 × 103 (580 days)28
    Lifetime based on synergistic effects (thermal loads and He irradiation)∼1 × 10³ shotsMinutesSeconds
    Table 1. HiPER operating conditions for the three HiPER scenarios (Experimental, Prototype, and Demo) together with the main operating parameters and the predicted lifetimes based on purely thermomechanical considerations and on synergistic effects (combined effect of pulsed thermal load up to 105 MW m−2 and high-flux high-energy He irradiation).
    Neutron flux (m−2 s−1)1 × 10¹⁸
    Average power density (kW m−3)8115
    Damage rate (dpa/dpy)1.6
    Transmutation rate H (appm/fpy)3
    Transmutation rate He (appm/fpy)0.7
    H (dpa)1.9
    He (dpa)0.5
    Table 2. Neutron flux, average power density, damage rate, and transmutation rates caused by neutron irradiation in W in the HiPER Demo scenario. fpy stands for full power year.
    AnnealingRetained hydrogen as a percentage of implanted hydrogen (%)Main H Release path
    Time (min.)Temperature (K)Simulations MMonCaExperimental RNRAaGBsSample surface
    Nanostructured5348YN
    Monocrystalline95NN
    Nanostructured304734639YN
    Monocrystalline3047395NN
    Nanostructured305731725YY
    Monocrystalline3057323NY
    Table 3. Brief overview of the type of W, annealing time and temperature, fraction of retained H obtained from experiments and simulations and main path for H release for nanostructured tungsten, and for monocrystalline samples. Prior to the analysis, all samples were first irradiated with 665-keV C ions and then with 170-keV H ions, both at room temperature and at a fluence of 5 × 10²⁰ m−2. Identical irradiation parameters were used for computational simulations. Data taken from Ref. 113.
    R. Gonzalez-Arrabal, A. Rivera, J. M. Perlado. Limitations for tungsten as plasma facing material in the diverse scenarios of the European inertial confinement fusion facility HiPER: Current status and new approaches[J]. Matter and Radiation at Extremes, 2020, 5(5): 055201
    Download Citation