• Advanced Photonics
  • Vol. 1, Issue 5, 056001 (2019)
Peng Wang1, Xiong Shen1, Jun Liu1、2、3、*, and Ruxin Li1、2、3、*
Author Affiliations
  • 1Chinese Academy of Sciences, Shanghai Institute of Optics and Fine Mechanics, State Key Laboratory of High Field Laser Physics, Shanghai, China
  • 2University of Chinese Academy of Sciences, Center of Materials Science and Optoelectronics Engineering, Beijing, China
  • 3Chinese Academy of Sciences, Shanghai Institute of Optics and Fine Mechanics, CAS Center for Excellence in Ultra-intense Laser Science, Shanghai, China
  • show less
    DOI: 10.1117/1.AP.1.5.056001 Cite this Article Set citation alerts
    Peng Wang, Xiong Shen, Jun Liu, Ruxin Li. Single-shot fourth-order autocorrelator[J]. Advanced Photonics, 2019, 1(5): 056001 Copy Citation Text show less
    (a) The testing pulse with a postpulse, (b) the second-order autocorrelation signal, (c) the third-order autocorrelation signal, and (d) the fourth-order autocorrelation signal.
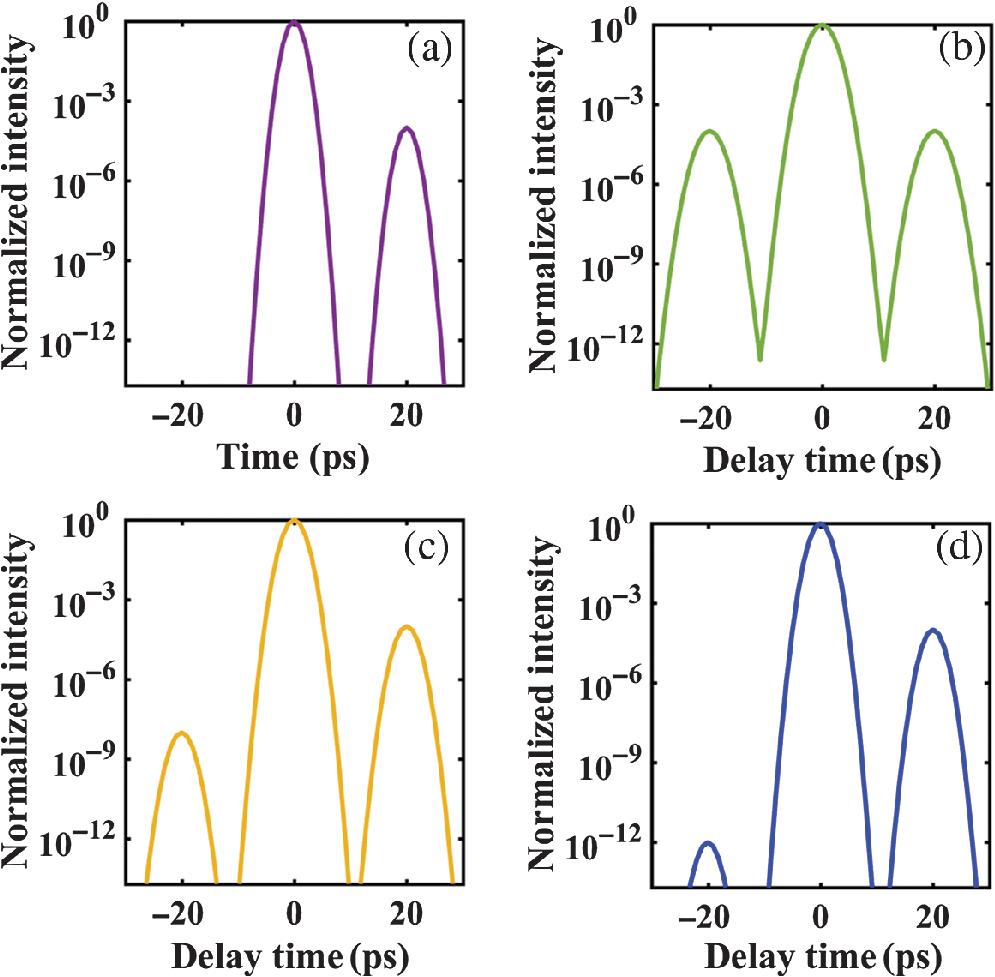
    Fig. 1. (a) The testing pulse with a postpulse, (b) the second-order autocorrelation signal, (c) the third-order autocorrelation signal, and (d) the fourth-order autocorrelation signal.
    The GVM in TOAC and FOAC.
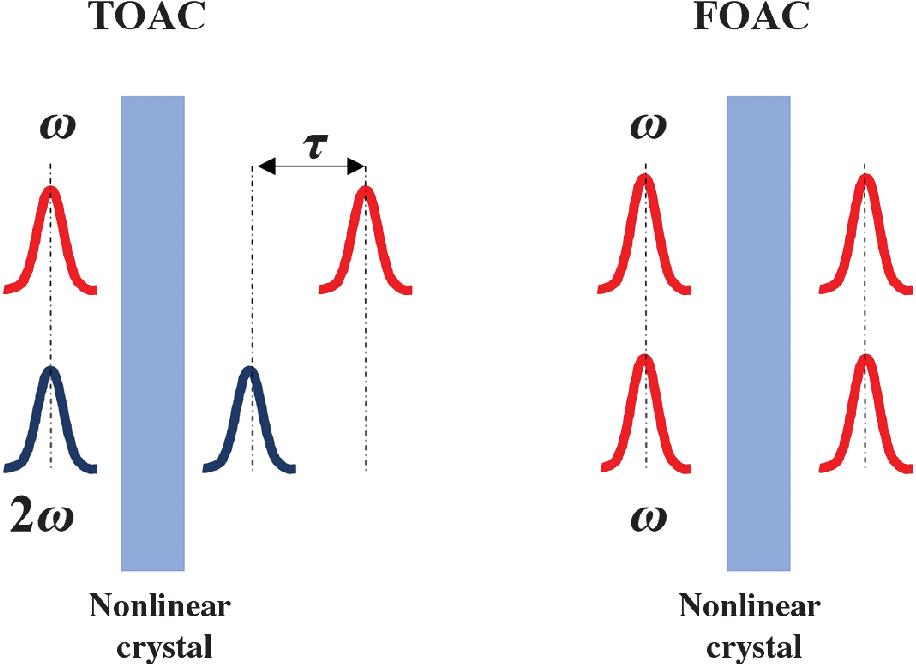
    Fig. 2. The GVM in TOAC and FOAC.
    Schematic representation of the proof-of-principle experimental setup using FOAC for single-shot TC measurement. BS1 and BS2: two beam splitters. CCM1–CCM3: three concave cylindrical mirrors. DL1 and DL2: two time delay lines. GP: a glass plate for SD signal generation. BE1 and BE2: two beam expanders. DF: a strip-shaped density filter. CW: a coated wedge. L1 and L2: two lenses that form the 4f imaging system. BPF: a bandpass filter.
    Fig. 3. Schematic representation of the proof-of-principle experimental setup using FOAC for single-shot TC measurement. BS1 and BS2: two beam splitters. CCM1–CCM3: three concave cylindrical mirrors. DL1 and DL2: two time delay lines. GP: a glass plate for SD signal generation. BE1 and BE2: two beam expanders. DF: a strip-shaped density filter. CW: a coated wedge. L1 and L2: two lenses that form the 4f imaging system. BPF: a bandpass filter.
    (a) The intensity distribution of the original signal and the replica on the sCMOS. The original signal and the replica are shown in the rectangle area marked with white-dashed lines. The part of the replica signal marked with red lines is zoomed for better visibility in the larger of the two red rectangles. (b) The intensity distribution of the original signal and the replica along the horizontal direction.
    Fig. 4. (a) The intensity distribution of the original signal and the replica on the sCMOS. The original signal and the replica are shown in the rectangle area marked with white-dashed lines. The part of the replica signal marked with red lines is zoomed for better visibility in the larger of the two red rectangles. (b) The intensity distribution of the original signal and the replica along the horizontal direction.
    TC results of a Ti:sapphire regenerative amplifier measured using the Sequoia-800 (solid line) and our single-shot FOAC equipment (dashed line).
    Fig. 5. TC results of a Ti:sapphire regenerative amplifier measured using the Sequoia-800 (solid line) and our single-shot FOAC equipment (dashed line).
    Correlation traces by the TOAC and FOAC with a linear plot of intensity.
    Fig. 6. Correlation traces by the TOAC and FOAC with a linear plot of intensity.
    The measurement results with a dynamic range of 1011 by the FOAC. (a) The correlation signals on the sCMOS detector. (b) The comparison of the TOAC and FOAC measurement results. The strip-shaped density filters are used in the region of the dashed-line rectangle.
    Fig. 7. The measurement results with a dynamic range of 1011 by the FOAC. (a) The correlation signals on the sCMOS detector. (b) The comparison of the TOAC and FOAC measurement results. The strip-shaped density filters are used in the region of the dashed-line rectangle.
    The detector noise from the sCMOS and scattering noise from the SHG signals.
    Fig. 8. The detector noise from the sCMOS and scattering noise from the SHG signals.
    The measurement results of the single-shot FOAC and delay-scanning TOAC (Sequoia-800). (a) The correlation signals on the sCMOS detector. (b) The correlation signals on the sCMOS detector when the range of the color bar is adjusted to make the weak signal more visible. (c) The comparison of the TOAC and FOAC measurement results. The strip-shaped density filters are used in the region of the dashed-line rectangle.
    Fig. 9. The measurement results of the single-shot FOAC and delay-scanning TOAC (Sequoia-800). (a) The correlation signals on the sCMOS detector. (b) The correlation signals on the sCMOS detector when the range of the color bar is adjusted to make the weak signal more visible. (c) The comparison of the TOAC and FOAC measurement results. The strip-shaped density filters are used in the region of the dashed-line rectangle.
    Peng Wang, Xiong Shen, Jun Liu, Ruxin Li. Single-shot fourth-order autocorrelator[J]. Advanced Photonics, 2019, 1(5): 056001
    Download Citation