• Acta Optica Sinica
  • Vol. 41, Issue 17, 1730004 (2021)
Yamei Luo1, Lin Jian1, Haoqi Luo2, Keying Huang2, Wolun Zhang2, Zhulou Wang1, Huizhi Zhang1, Qian Xiao1、**, and Shaohui Huang1、3、*
Author Affiliations
  • 1Laboratory of Interdisciplinary Research, Institute of Biophysics, Chinese Academy of Sciences, Beijing 100101, China
  • 2LightEdge Technologies Ltd., Zhongshan, Guangdong 528400, China
  • 3University of Chinese Academy of Sciences, Beijing 100049, China
  • show less
    DOI: 10.3788/AOS202141.1730004 Cite this Article Set citation alerts
    Yamei Luo, Lin Jian, Haoqi Luo, Keying Huang, Wolun Zhang, Zhulou Wang, Huizhi Zhang, Qian Xiao, Shaohui Huang. Fluorescence Auto-Correlation Spectroscopy Quantitatively Measures Antigen-Antibody Binding Affinity[J]. Acta Optica Sinica, 2021, 41(17): 1730004 Copy Citation Text show less
    Schematic of optical pathway of benchtop FCS system
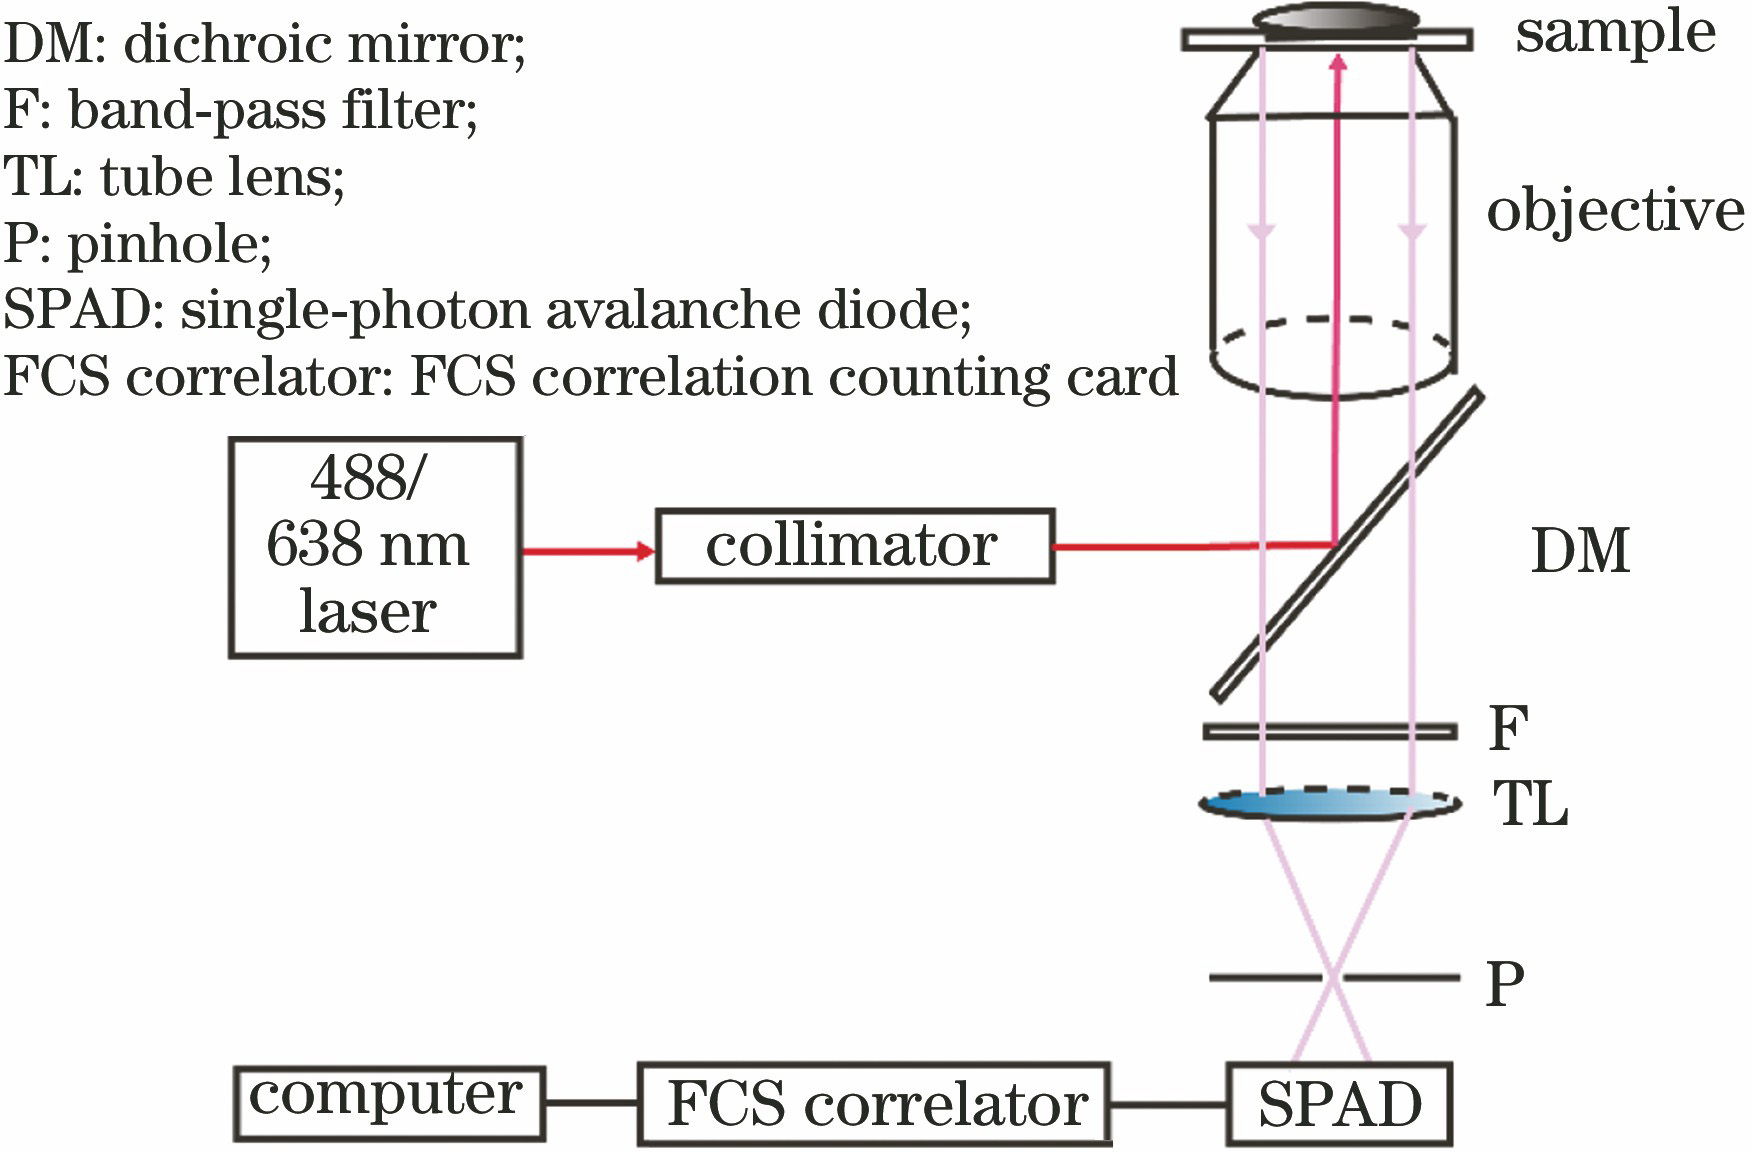
    Fig. 1. Schematic of optical pathway of benchtop FCS system
    Flow chart of the data analysis software for determining antigen-antibody binding affinity
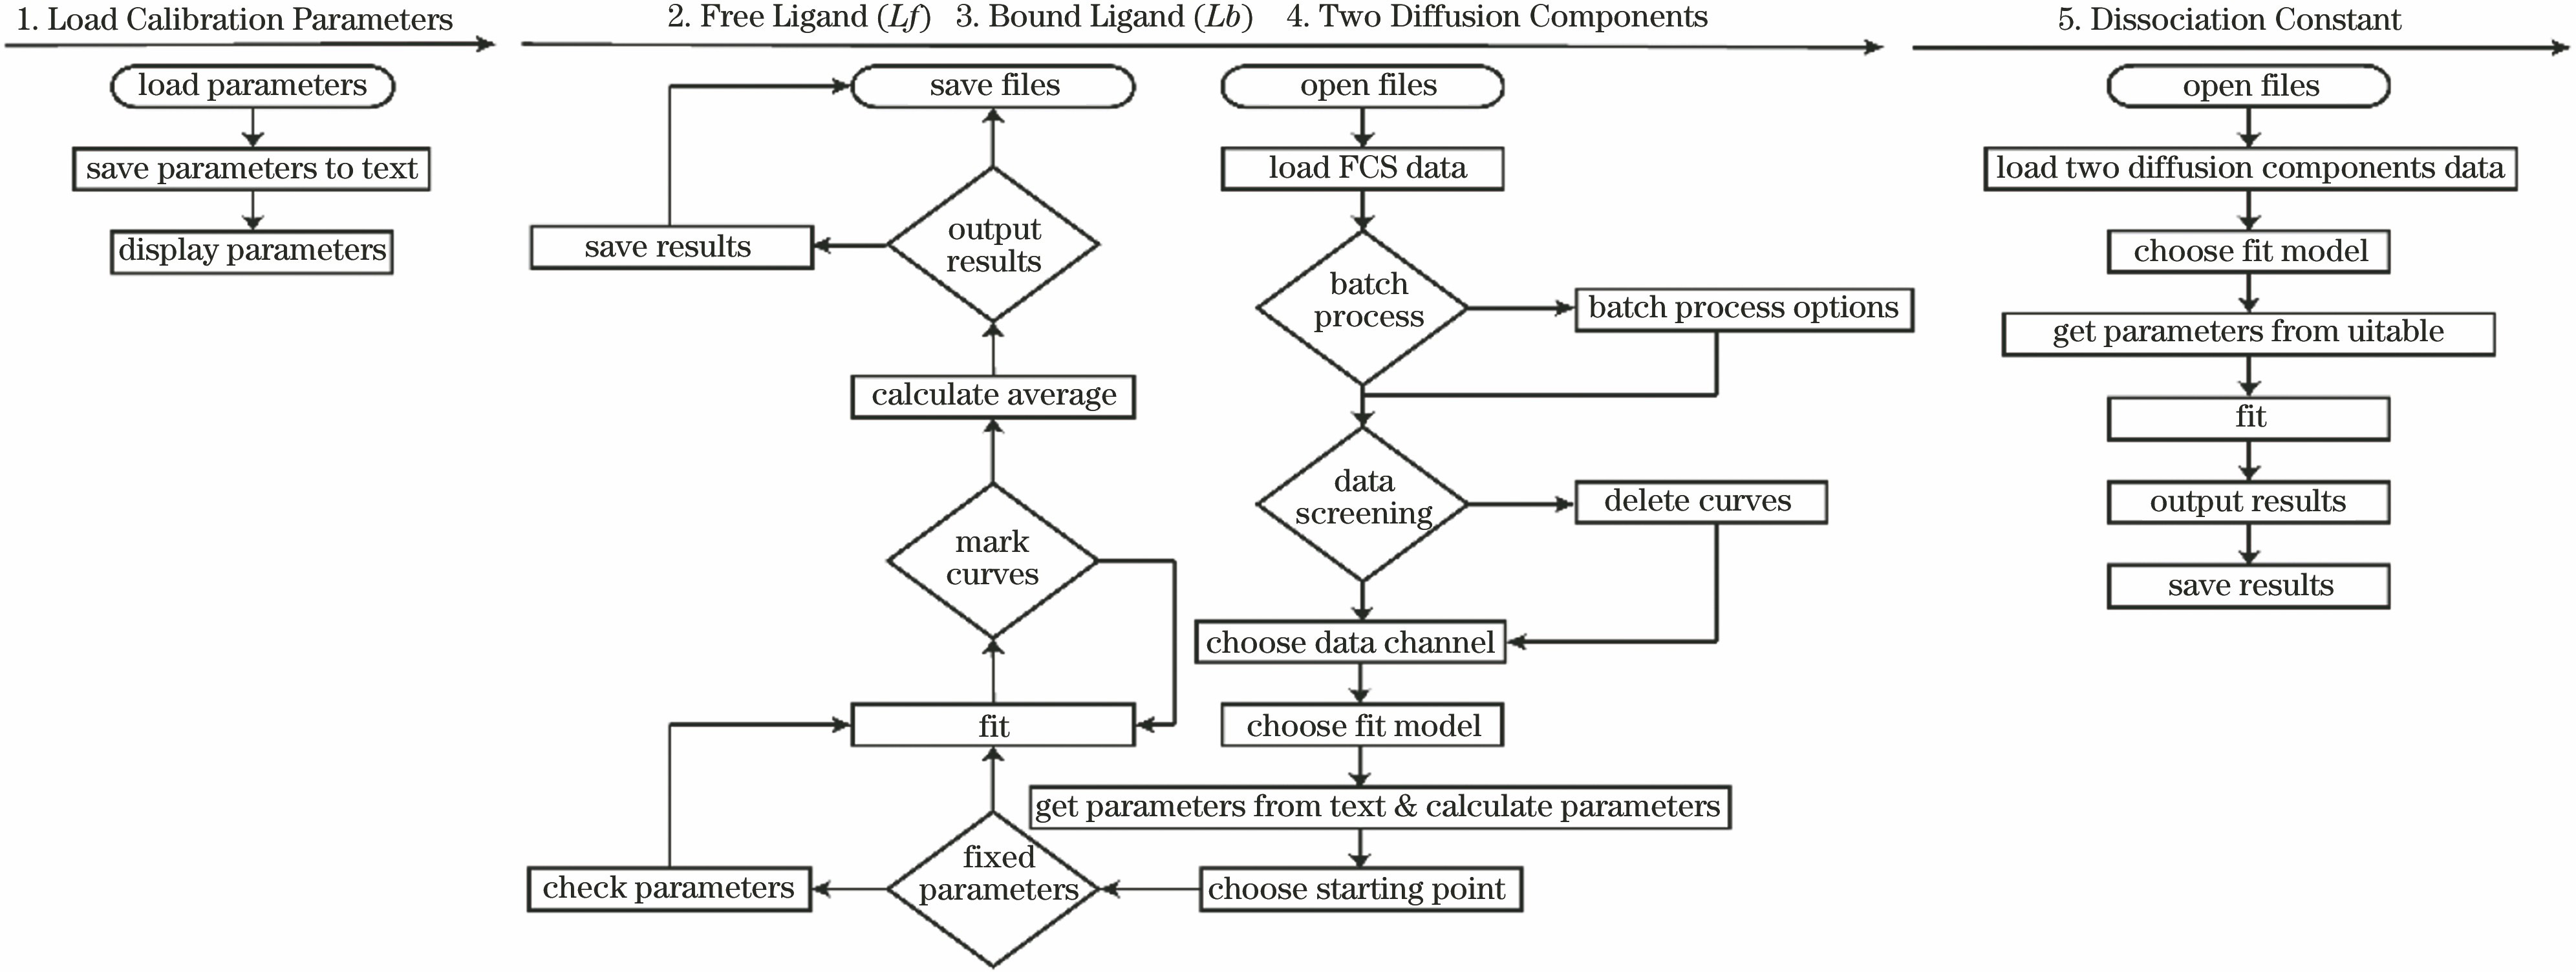
    Fig. 2. Flow chart of the data analysis software for determining antigen-antibody binding affinity
    Analyze the affinity of Alex647 fluorescent molecule antigen and antibody using FCS and MEM methods. (a) Normalized fluorescence auto-correlation curves of a standard fluorescent molecule sample, a free Alexa Fluor647 antigen sample, and a bound antigen sample; (b) normalized fluorescence auto-correlation curves of Alexa Fluor647 mixed with different concentrations of monoclonal antibody; (c) distribution curves of diffusion correlation time of the free and bound Alexa Fluor647 obtained by MEM analyses of the 13 antigen-antibody samples; (d) antigen-antibody dissociation constant was obtained by non-linear least squares fitting of the bound antigen fractions data with different concentrations of antibody
    Fig. 3. Analyze the affinity of Alex647 fluorescent molecule antigen and antibody using FCS and MEM methods. (a) Normalized fluorescence auto-correlation curves of a standard fluorescent molecule sample, a free Alexa Fluor647 antigen sample, and a bound antigen sample; (b) normalized fluorescence auto-correlation curves of Alexa Fluor647 mixed with different concentrations of monoclonal antibody; (c) distribution curves of diffusion correlation time of the free and bound Alexa Fluor647 obtained by MEM analyses of the 13 antigen-antibody samples; (d) antigen-antibody dissociation constant was obtained by non-linear least squares fitting of the bound antigen fractions data with different concentrations of antibody
    FCS and MEM Analyses of GFP antigen-antibody binding affinity. (a)Normalized fluorescence auto-correlation curves of a standard fluorescent molecule sample, a free GFP antigen sample, and a bound antigen sample; (b) normalized fluorescence auto-correlation curves of samples composed of GFP mixed with different concentrations of monoclonal antibody; (c) distribution curves of diffusion correlation time of the free and bound GFP obtained by MEM analyses of the antigen-antibody samples; (d) antigen-antibody dissociation constant was obtained by non-linear least squares fitting of the bound antigen fractions data with different concentrations of antibody
    Fig. 4. FCS and MEM Analyses of GFP antigen-antibody binding affinity. (a)Normalized fluorescence auto-correlation curves of a standard fluorescent molecule sample, a free GFP antigen sample, and a bound antigen sample; (b) normalized fluorescence auto-correlation curves of samples composed of GFP mixed with different concentrations of monoclonal antibody; (c) distribution curves of diffusion correlation time of the free and bound GFP obtained by MEM analyses of the antigen-antibody samples; (d) antigen-antibody dissociation constant was obtained by non-linear least squares fitting of the bound antigen fractions data with different concentrations of antibody
    TechnologyTheoryCharacteristicsSensitivity
    Isothermal Titration Calorimetry(ITC) [22-23]By detecting the dynamic heat changes during the reaction process of antibody ligand binding, ITC calculates the binding thermodynamic and kinetic parametersNo need to label the sample. Antibody concentration is 15-50 μM. The ligand concentration is 15 times that of the antibody. Sample amount is a few microlitersEach test takes 2-2.5 hThe small heat change lower than 0.4 μJ in the reaction process cannot be testedThe affinity of the antigen and antibody can be detected in the natural binding stateAntigen-antibody affinity test with KD value at 10-9-10-2 M
    Surface Plasmon Resonance(SPR)[24-26]When the ligand flows through the antibody fixed on the chip surface at a certain speed and binds to it, SPR calculates the affinity value by fitting the weight changes of the chip during the biding processSample is fixed on the chip. The sample preparation has to be careful to avoid the damage of the active structure of the sample and produce non-characteristic binding. The detection limit is on the order of 10 pg/mL. Sample amount is micrograms to sub-microgramsEach test takes several minutesGet reaction information of binding kinetics and concentration change during bindingAntigen-antibody affinity test with KD value at 10-9-10-3 M
    Microscale Thermophoresis(MST)[22]A temperature gradient is induced by an infrared laser. By combining the precise fluorescence detection and sensitive thermophoresis, MST detects the molecular interactionsNo need to fix the sample, but the sample has to be fluorescent labeled. Sample amount is a few microliters at nanomolar concentration. The ligand concentration is a few mg/mLEach test takes several minutesEnergetic detection of affinity. The affinity of the antigen and antibody can be detected in the natural binding stateAntigen-antibody affinity test with KD value below 10-9 M
    Fluorescence Correlation Spectroscopy(FCS)[14,27]By applying the autocorrelation analysis to the fluorescence signal fluctuations during the binding reaction, FCS calculates intermolecular affinityNo need to fix the sample, but the sample has to be fluorescent labeled. Sample concentration is pM-nM. Sample amount is tens of microlitersEach test takes several seconds The affinity of the antigen and antibody can be detected in the natural binding stateAntigen-antibody affinity test with KD value at 10-12-10-7 M
    Table 1. Comparison of FCS with other technologies for quantitatively determining antigen-antibody binding affinity
    Yamei Luo, Lin Jian, Haoqi Luo, Keying Huang, Wolun Zhang, Zhulou Wang, Huizhi Zhang, Qian Xiao, Shaohui Huang. Fluorescence Auto-Correlation Spectroscopy Quantitatively Measures Antigen-Antibody Binding Affinity[J]. Acta Optica Sinica, 2021, 41(17): 1730004
    Download Citation