• Acta Optica Sinica
  • Vol. 43, Issue 3, 0312007 (2023)
Huaikun Wei1, Shuhu Huan1, Ying Liu1, Huoyao Chen2, Keqiang Qiu1, Zhengkun Liu1、*, and Yilin Hong1
Author Affiliations
  • 1National Synchrotron Radiation Laboratory, University of Science and Technology of China, Hefei 230029, Anhui, China
  • 2Anhui Zhongke Grating Technology Company Limited, Hefei 231605, Anhui, China
  • show less
    DOI: 10.3788/AOS221409 Cite this Article Set citation alerts
    Huaikun Wei, Shuhu Huan, Ying Liu, Huoyao Chen, Keqiang Qiu, Zhengkun Liu, Yilin Hong. Stitching Measurement of Line Density of Variable-Line-Spacing Gratings with Long Trace Profiler[J]. Acta Optica Sinica, 2023, 43(3): 0312007 Copy Citation Text show less
    Detection of grating line density when the beam is incident at the grating Littrow angle
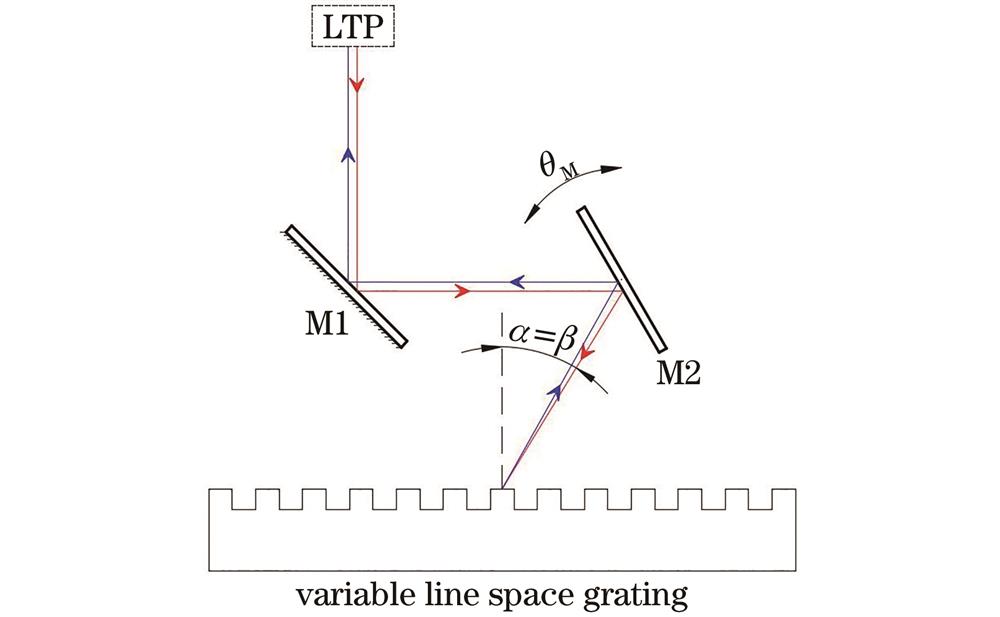
    Fig. 1. Detection of grating line density when the beam is incident at the grating Littrow angle
    Experimental grating diagram. (a) Physical diagram of variable pitch grating; (b) diagram of grating size and measurement position
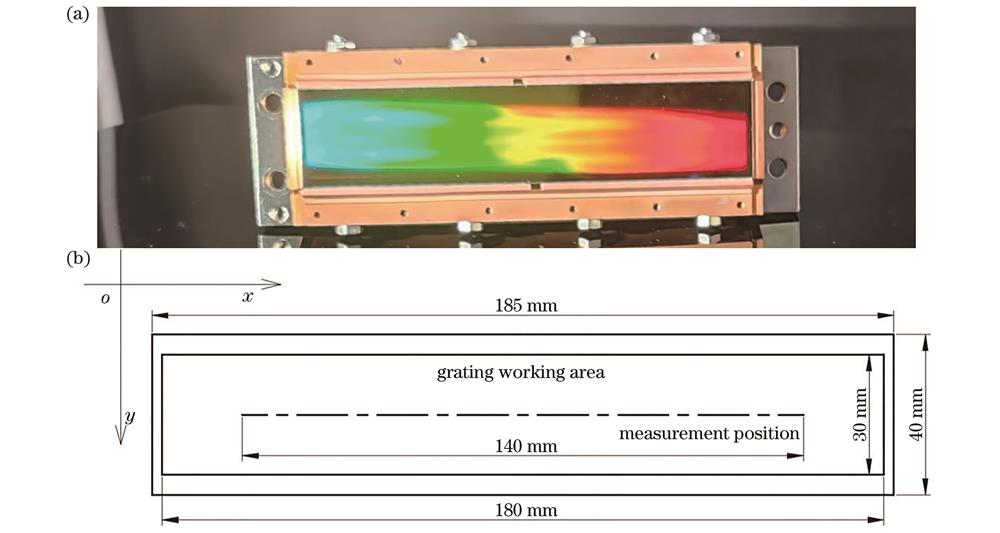
    Fig. 2. Experimental grating diagram. (a) Physical diagram of variable pitch grating; (b) diagram of grating size and measurement position
    Flow chart for calculating line density
    Fig. 3. Flow chart for calculating line density
    Diagram of correspondence between the positions of adjacent segments
    Fig. 4. Diagram of correspondence between the positions of adjacent segments
    Difference between two measurements of line density in 13 segments. (a) Calculated by line density splicing method;(b) calculated by slope splicing method
    Fig. 5. Difference between two measurements of line density in 13 segments. (a) Calculated by line density splicing method;(b) calculated by slope splicing method
    Difference curves of line density measurements minus the corresponding line density fits in four sets of experiments
    Fig. 6. Difference curves of line density measurements minus the corresponding line density fits in four sets of experiments
    Difference curves between different experimental groups
    Fig. 7. Difference curves between different experimental groups
    GroupingN0 /(lp·mm-1N1 /(lp·mm-2N2 /(lp·mm-3N3 /(lp·mm-4
    7-segment line1399.9951.1574084.164×10-44.3×10⁻⁷
    9-segment line1399.9951.1573664.162×10-44.1×10⁻⁷
    13-segment line1399.9951.1574644.164×10-44.3×10⁻⁷
    25-segment line1399.9951.1574224.169×10-44.3×10⁻⁷
    Design value14001.1543004.203×10-4
    Table 1. Coefficients of fitting equation corresponding to each group of line density measurements
    GroupingΔN/N0(RMS)aPV,max /(lp·mm-1
    25-segment line-7-segment line1.13×10-60.00658
    25-segment line-9-segment line1.12×10-60.00542
    25-segment line-13-segment line1.02×10-60.00382
    Table 2. Repeatability and smoothing of differences between 4 sets of line density measurements
    Huaikun Wei, Shuhu Huan, Ying Liu, Huoyao Chen, Keqiang Qiu, Zhengkun Liu, Yilin Hong. Stitching Measurement of Line Density of Variable-Line-Spacing Gratings with Long Trace Profiler[J]. Acta Optica Sinica, 2023, 43(3): 0312007
    Download Citation