• Laser & Optoelectronics Progress
  • Vol. 58, Issue 24, 2417001 (2021)
zhenzhen Wan1, Shaoyong Zhang1, Fang Liu3、4, Ning Shi2、*, Shuai Han1, and Chunxue Li1
Author Affiliations
  • 1College of Electronic Information Engineering, Hebei University, Baoding, Hebei 0 71002, China
  • 2Hebei Software Institute, Baoding, Hebei 0 71030, China
  • 3Pathology Department, Baoding Children's Hospital, Baoding, Hebei 0 71051, China
  • 4Key Laboratory of Clinical Research on Children's Respiratory Digestive Diseases in Baoding City, Baoding, Hebei 0 71051, China
  • show less
    DOI: 10.3788/LOP202158.2417001 Cite this Article Set citation alerts
    zhenzhen Wan, Shaoyong Zhang, Fang Liu, Ning Shi, Shuai Han, Chunxue Li. Computer-Aided Evaluation of Ki-67 on Pathological Sections of Appendiceal Neuroendocrine Neoplasms[J]. Laser & Optoelectronics Progress, 2021, 58(24): 2417001 Copy Citation Text show less
    Pathological section of ANENs
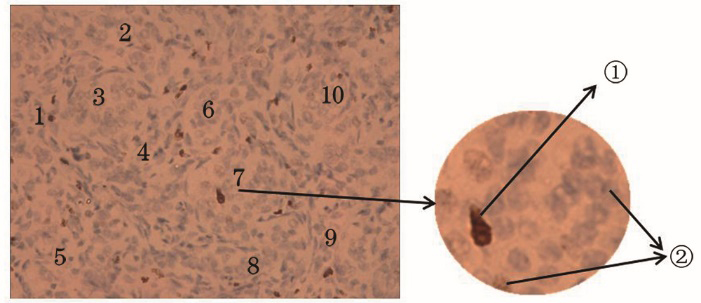
    Fig. 1. Pathological section of ANENs
    Overall design flow chart of the system scheme
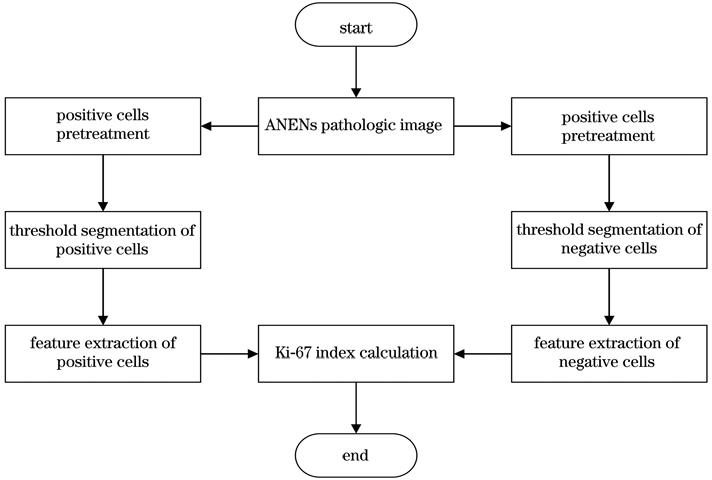
    Fig. 2. Overall design flow chart of the system scheme
    Image of ANENs pathological section (left) and color image of YUV (right)
    Fig. 3. Image of ANENs pathological section (left) and color image of YUV (right)
    YUV spatial threshold segmentation images. (a) Threshold segmentation image of positive cell; (b) threshold segmentation image of negative cells
    Fig. 4. YUV spatial threshold segmentation images. (a) Threshold segmentation image of positive cell; (b) threshold segmentation image of negative cells
    Images processed by mathematical morphology. (a) Positive cell; (b) negative cells
    Fig. 5. Images processed by mathematical morphology. (a) Positive cell; (b) negative cells
    One-dimensional minimum highlight process. (a) One-dimensional data; (b) minimum highlight results
    Fig. 6. One-dimensional minimum highlight process. (a) One-dimensional data; (b) minimum highlight results
    Positive cells processing images obtained by improved watershed algorithm. (a) Image of ANENs pathological section; (b) distance transform image; (c) image by forced minimum technique processing; (d) image processed by improved watershed algorithm; (e) binary segmentation image; (f) color marker segmentation image
    Fig. 7. Positive cells processing images obtained by improved watershed algorithm. (a) Image of ANENs pathological section; (b) distance transform image; (c) image by forced minimum technique processing; (d) image processed by improved watershed algorithm; (e) binary segmentation image; (f) color marker segmentation image
    Negative cells processing images obtained by improved watershed algorithm. (a) Image of ANENs pathological section; (b) distance transform images; (c) image by forced minimum technique processing; (d) image processed by improved watershed algorithm; (e) binary segmentation image; (f) color marker segmentation image
    Fig. 8. Negative cells processing images obtained by improved watershed algorithm. (a) Image of ANENs pathological section; (b) distance transform images; (c) image by forced minimum technique processing; (d) image processed by improved watershed algorithm; (e) binary segmentation image; (f) color marker segmentation image
    Negative cells segmentation effect diagrams before and after algorithm improvement. (a)--(c) Traditional watershed algorithm; (d)--(f) improved watershed algorithm
    Fig. 9. Negative cells segmentation effect diagrams before and after algorithm improvement. (a)--(c) Traditional watershed algorithm; (d)--(f) improved watershed algorithm
    Over-segmentation rate data of negative cells
    Fig. 10. Over-segmentation rate data of negative cells
    Data analysis of Ki-67 index
    Fig. 11. Data analysis of Ki-67 index
    Comparison of time consumption on image processing
    Fig. 12. Comparison of time consumption on image processing
    Cell image No.Quantity of positive cellsDiagnostic requirement
    DoctorTraditional algorithmImproved algorithm
    1101210Yes
    2111311Yes
    3121412Yes
    49129Yes
    58118Yes
    6131512Yes
    7111311Yes
    8101210Yes
    Table 1. Experimental data of positive cells in ANENs pathological section images obtained by improved watershed algorithm
    No.Negative cell number from doctorNegative cell number from traditional algorithmOver-segmentation rate from traditional algorithm /%Negative cell number from improved algorithmOver-segmentation rate from improved algorithm /%Improved algorithm’s accuracy /%
    142352410.74543.592.7
    243053110.54653.991.9
    34285169.34684.590.7
    437045210.03912.894.3
    535144311.73682.495.2
    64805769.14961.696.7
    742152410.94574.191.4
    84084989.94302.694.6
    Table 2. Experimental data of negative cells in ANENs pathological section images
    Experimental group No.Ki-67 index from doctor /%Ki-67 index from computer /%Ki-67 accuracy rate by computer /%Doctor’s time consumption /sComputer’s time consumption /sError rate from computer /%Diagnostic valueDiagnostic requirements
    12.312.1693.558296.5<3%Yes
    22.502.3192.459287.6<3%Yes
    32.732.5091.660308.4<3%Yes
    42.372.2595.055325.0<3%Yes
    52.232.1295.054315.0<3%Yes
    62.602.3690.858339.2<3%Yes
    72.552.3592.262277.8<3%Yes
    82.392.2794.953265.1<3%Yes
    Table 3. Experimental data of diagnostic indicators of ANENs pathological sections
    zhenzhen Wan, Shaoyong Zhang, Fang Liu, Ning Shi, Shuai Han, Chunxue Li. Computer-Aided Evaluation of Ki-67 on Pathological Sections of Appendiceal Neuroendocrine Neoplasms[J]. Laser & Optoelectronics Progress, 2021, 58(24): 2417001
    Download Citation