
Martin Neugebauer, Andrea Aiello, Peter Banzer. Linear and angular momenta in tightly focused vortex segmented beams of light (Invited Paper)[J]. Chinese Optics Letters, 2017, 15(3): 030003
- Chinese Optics Letters
- Vol. 15, Issue 3, 030003 (2017)
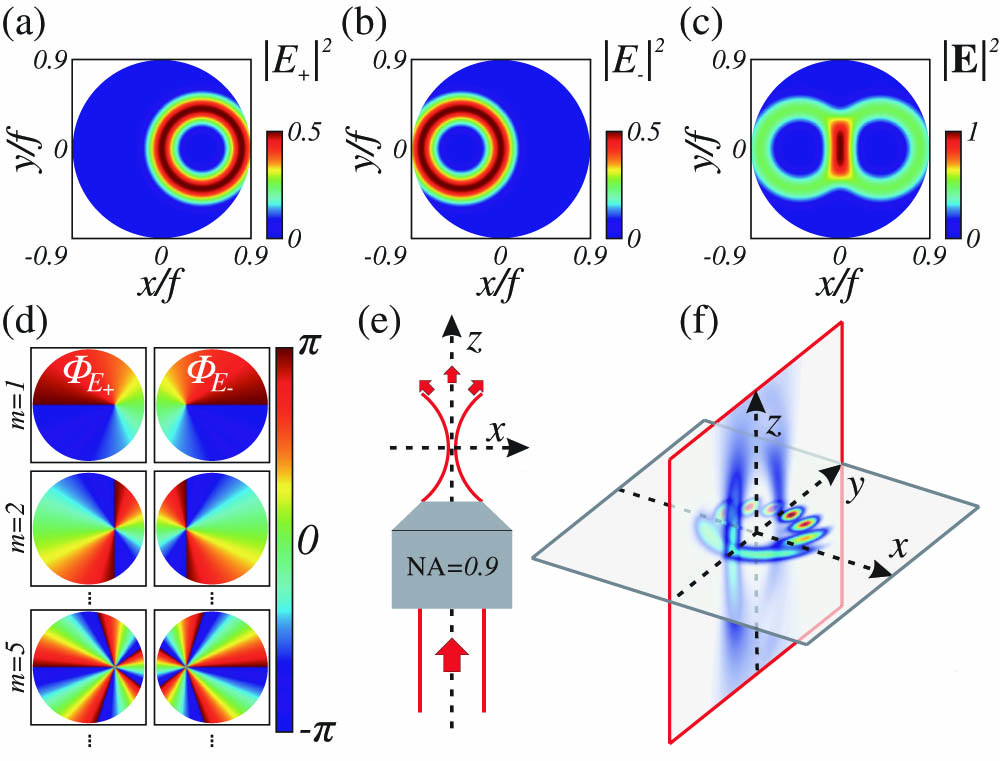
Fig. 1. Input field distribution before focusing and planes of observation in the focal region. The field intensity distributions of the right- (| E + | 2 | E − | 2 | E | 2 | E | 2 Φ E + Φ E − m x – y y – z
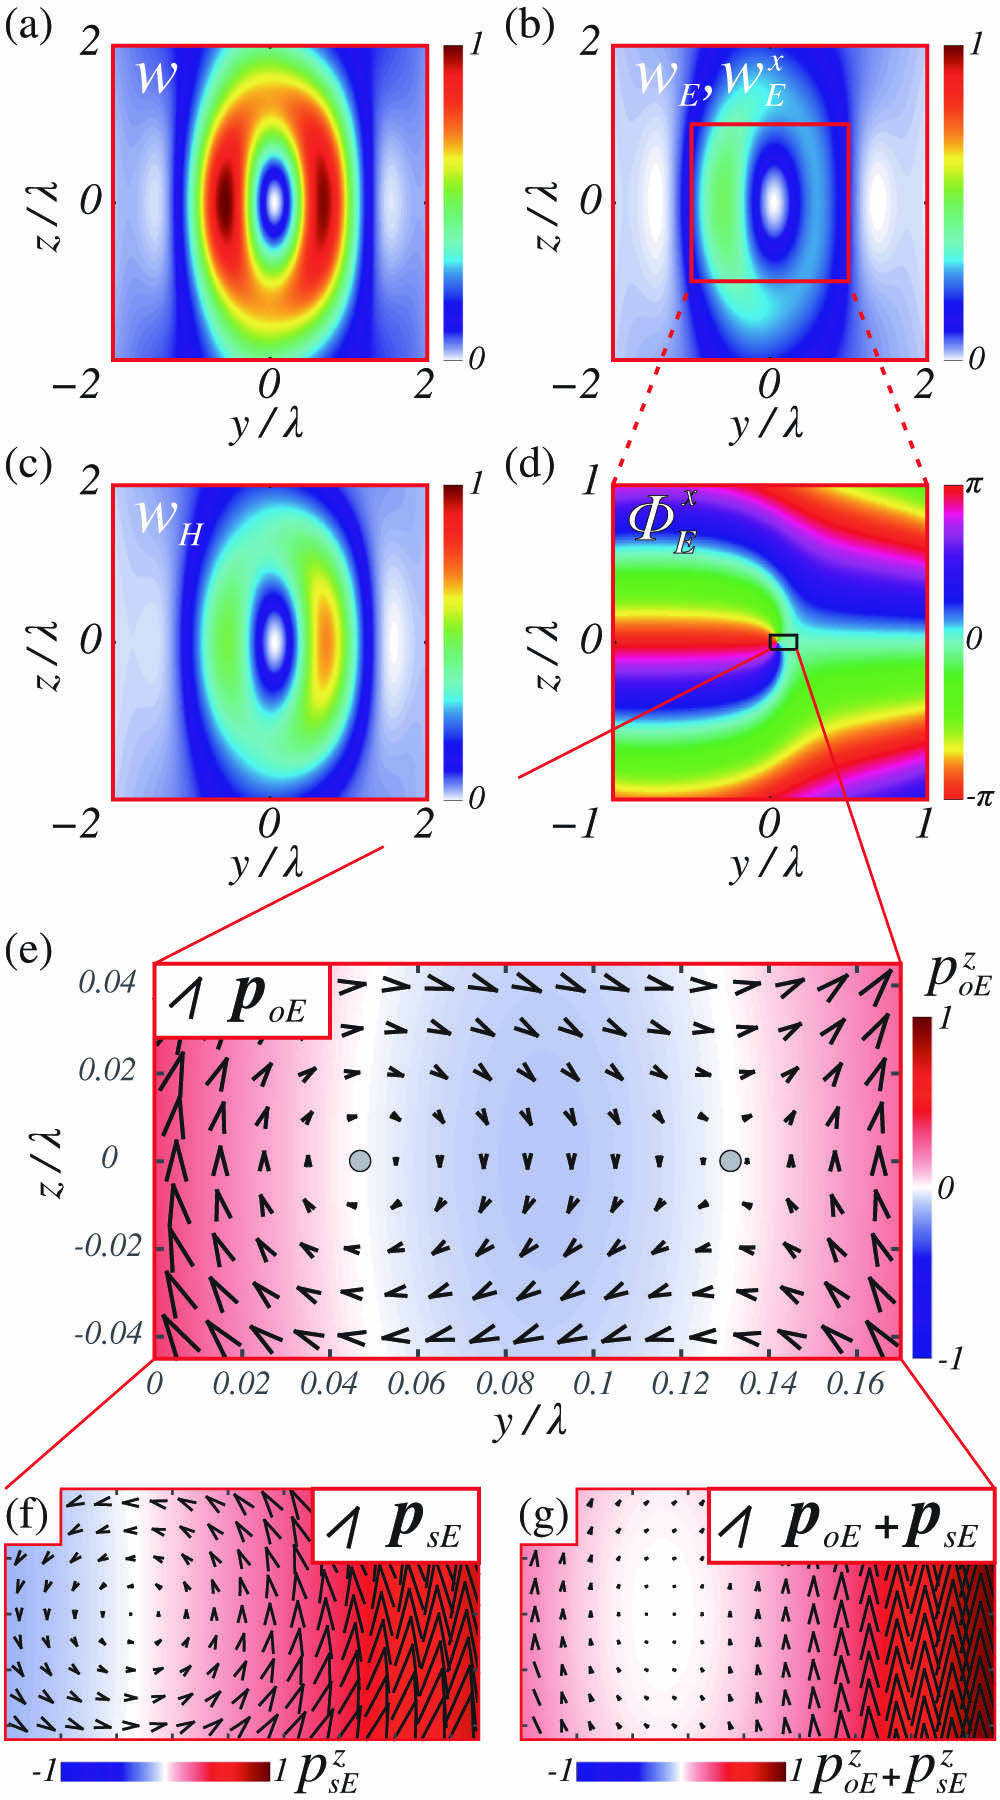
Fig. 2. Side view (meridional y – z m = 1 w w E w H w x Φ E x p o E p o E z p o E z p o E z p s E p ∝ p o E + p s E z
Fig. 3. Side view of a VSB with charge number m = 5 2(a) –2(d) .
Fig. 4. Energy and LM in the focal plane. (a) and (b) depict the focal plane of a VSB with charge number m = 1 w w E w H w p o z p z w p x p y p o x p o y λ m = 5 x w p o z p z m

Set citation alerts for the article
Please enter your email address
© Copyright 2018-2021 | Chinese Laser Press. All Rights Reserved 沪ICP备15018463号-20