
Cheng Cheng, Changbin Wu. PbS Quantum-Dot-Doped Fiber Amplifier in NIR S-C-L Ultra-Broad Waveband with Low Noise[J]. Acta Optica Sinica, 2018, 38(10): 1006006
- Acta Optica Sinica
- Vol. 38, Issue 10, 1006006 (2018)
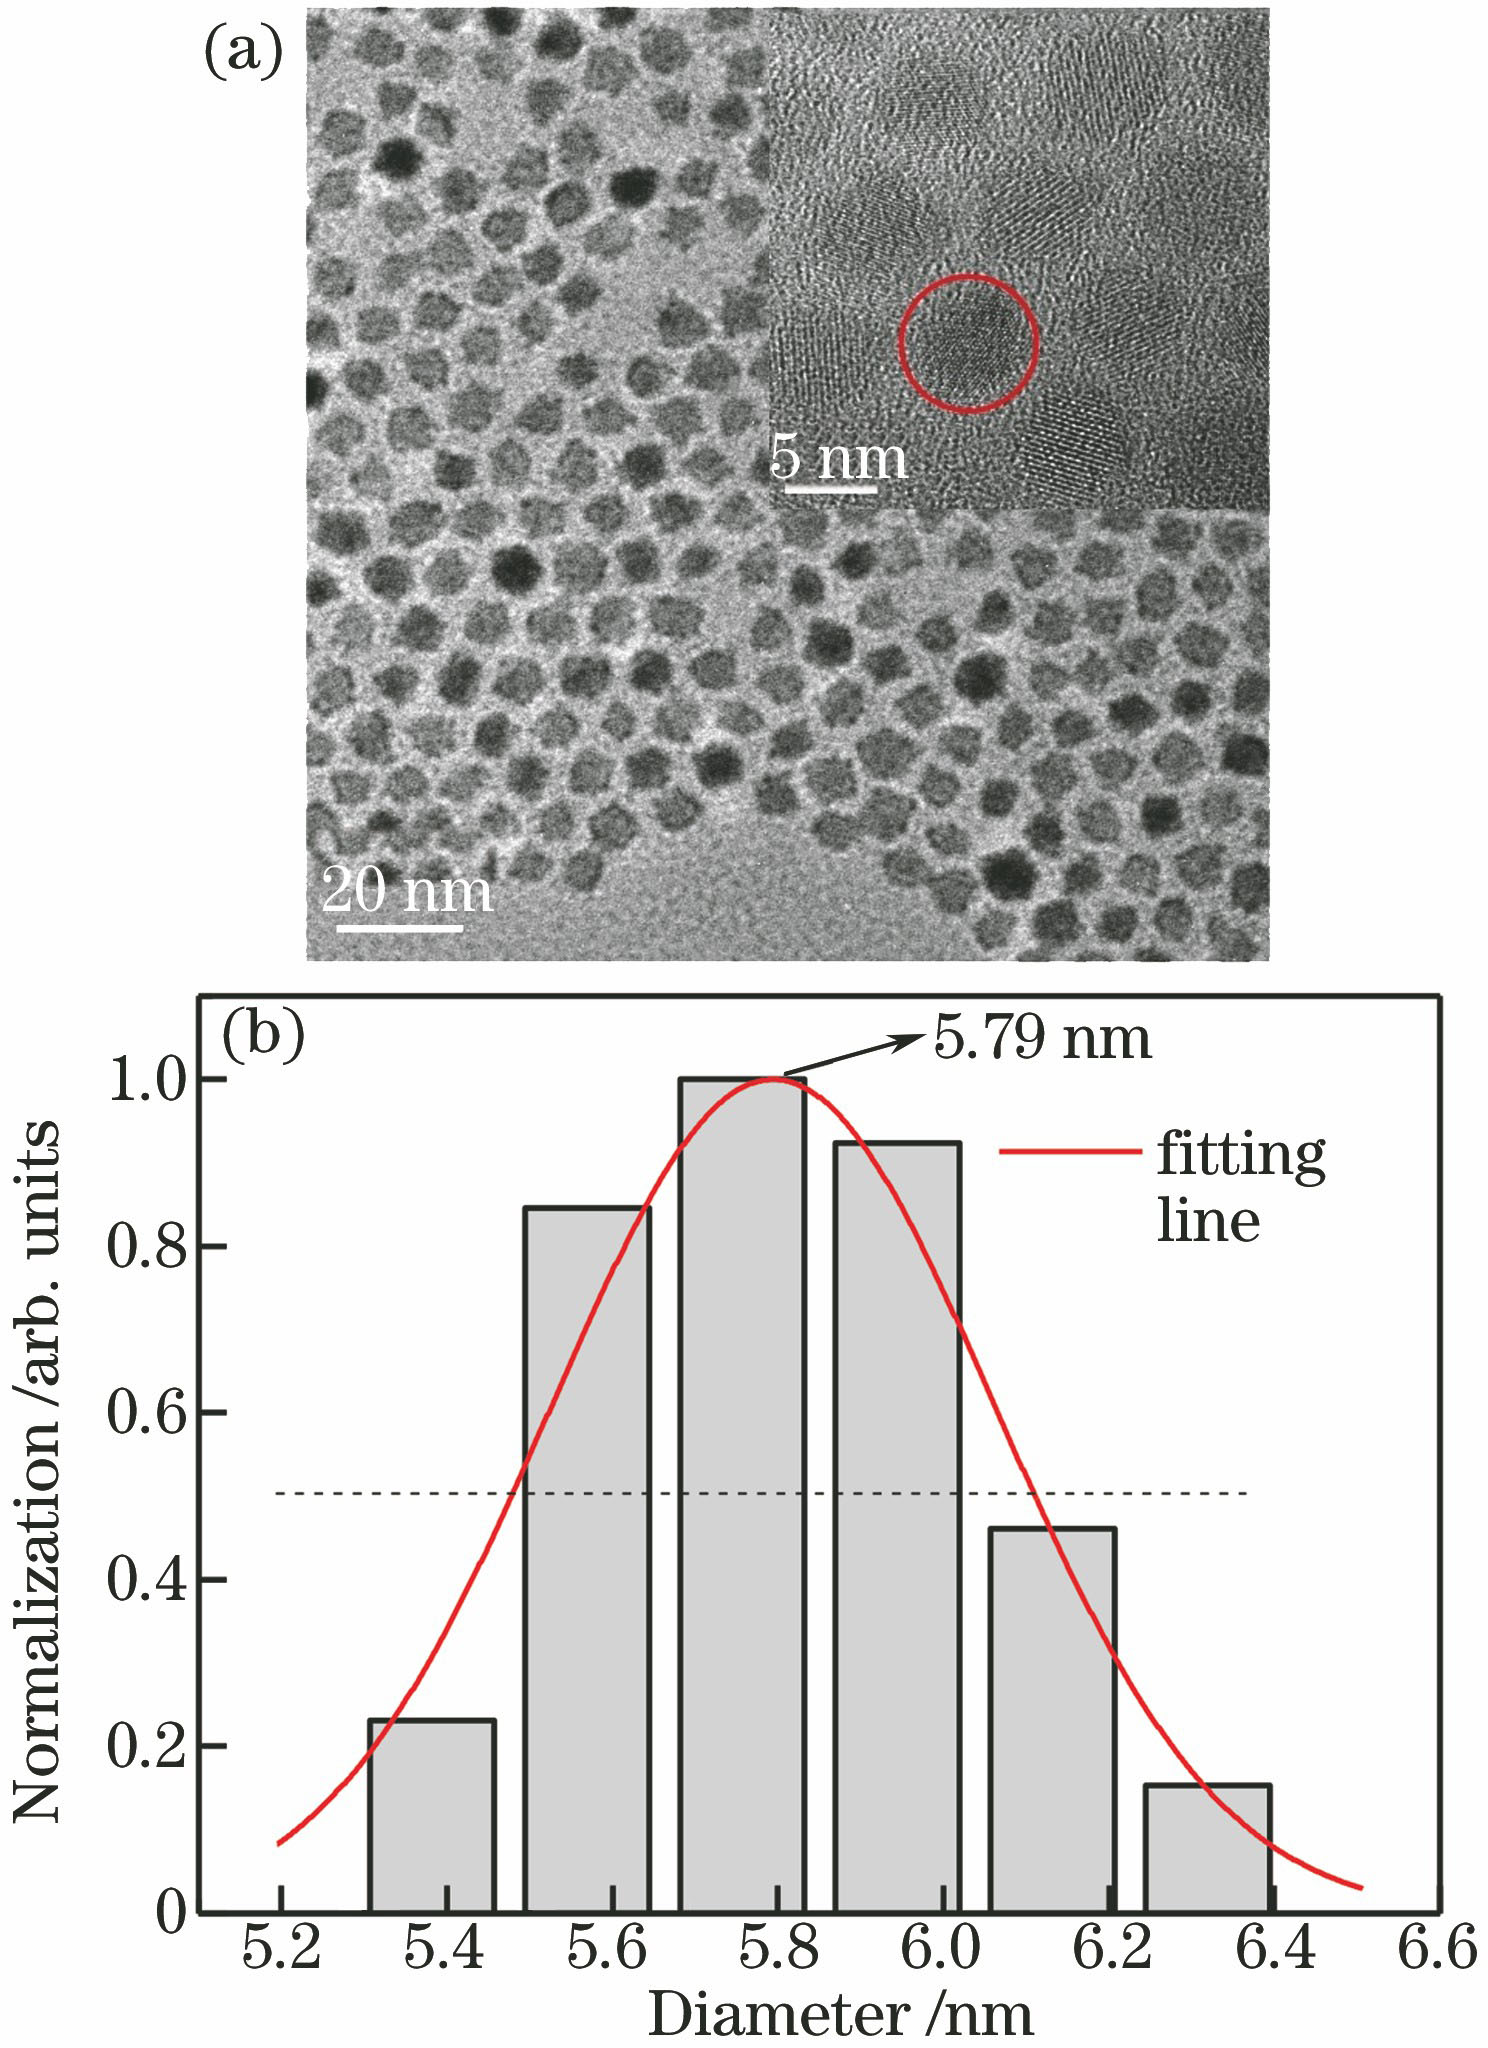
Fig. 1. (a) TEM images and (b) size distribution of PbS QDs
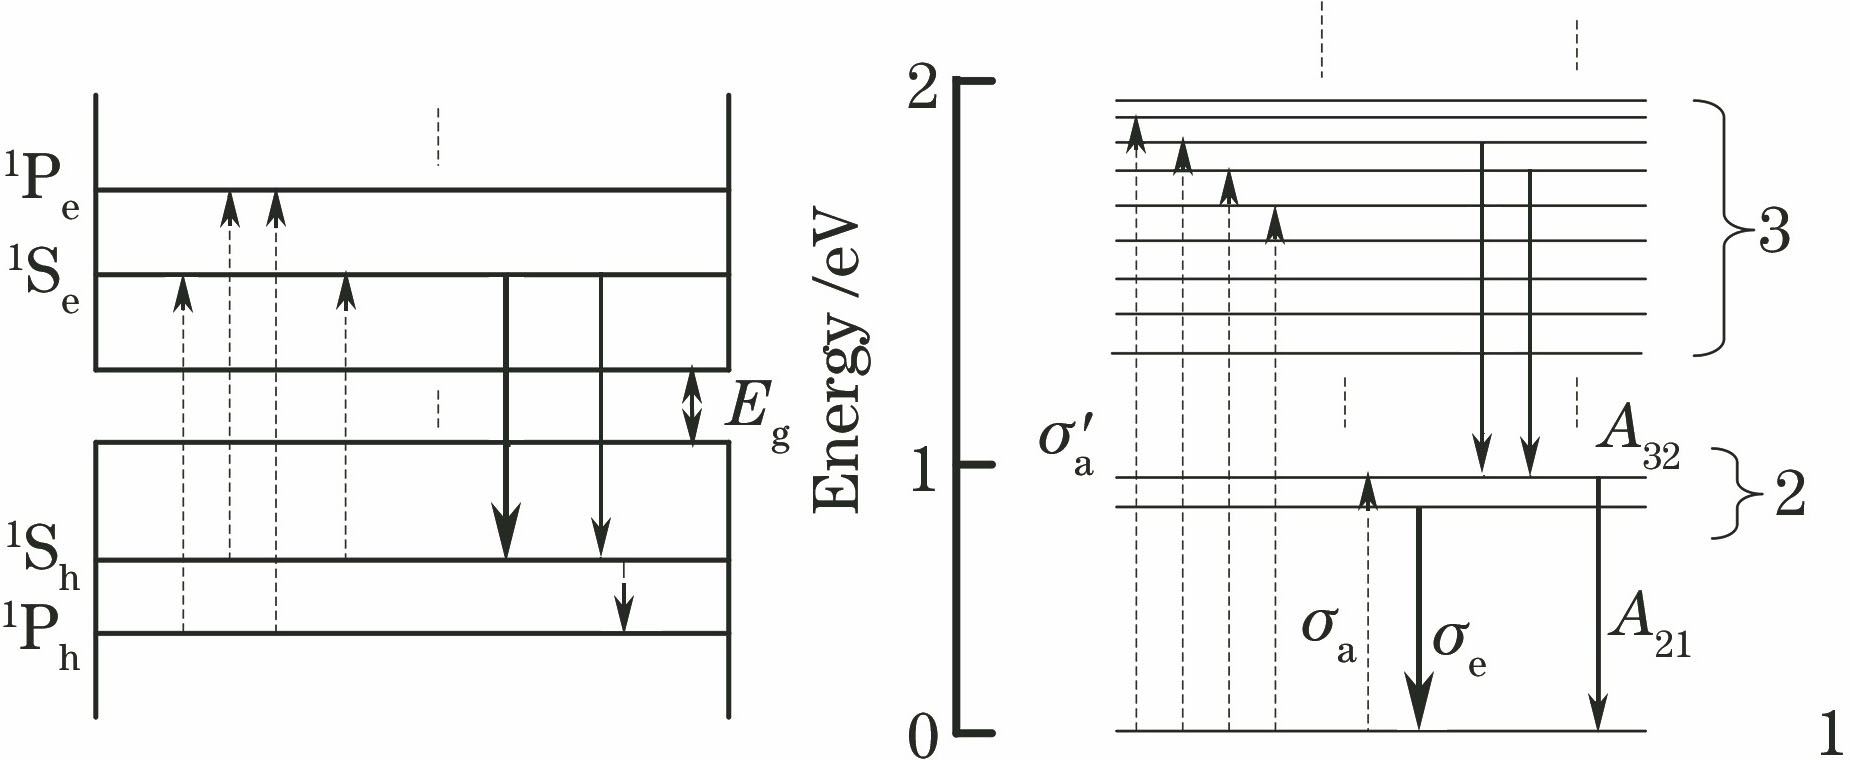
Fig. 2. Energy level diagram of PbS QDs
Fig. 3. Experimental setup of QDFA
Fig. 4. (a) Measured absorption spectrum and transmissivity of UV-gel background; (b) measured PL-emission and absorption spectra of PbS QDs
Fig. 5. (a) Measured pumping power in QDF as a function of fiber length; (b) attenuation of QDF varying with wavelength
Fig. 6. PL peak intensity of QDF as a function of fiber length under different doping concentrations
Fig. 7. Relationship between Lopt and doping concentration
Fig. 8. Output signal spectra of QDFA under different pumping powers, where the illustration is output spectrum for zero pump
Fig. 9. Signal gain of QDFA as a function of wavelength under different pumping powers
Fig. 10. Signal gain as a function of pumping power under different wavelengths, the insert shows the partial enlargement
Fig. 11. Signal gain as a function of fiber lengthunder different wavelengths
Fig. 12. Signal gain and NF of QDFA
|
Table 1. Comparison of performance among the proposed QDFA, EDFAs, and QDFA excited by evanescent wave

Set citation alerts for the article
Please enter your email address
© Copyright 2018-2021 | Chinese Laser Press. All Rights Reserved 沪ICP备15018463号-20