• Journal of Resources and Ecology
  • Vol. 11, Issue 6, 549 (2020)
Qinlin XIAO, Chao TIAN, Yanjun WANG, Xiuqing LI, and Liming XIAO*
Author Affiliations
  • School of Economics and Management, Shanxi Normal University, Linfen 041000, Shanxi, China
  • show less
    DOI: 10.5814/j.issn.1674-764x.2020.06.002 Cite this Article
    Qinlin XIAO, Chao TIAN, Yanjun WANG, Xiuqing LI, Liming XIAO. Measurement and Comparison of Urban Haze Governance Level and Efficiency based on the DPSIR Model: A Case Study of 31 Cities in North China[J]. Journal of Resources and Ecology, 2020, 11(6): 549 Copy Citation Text show less
    DPSIR model as applied to haze governance
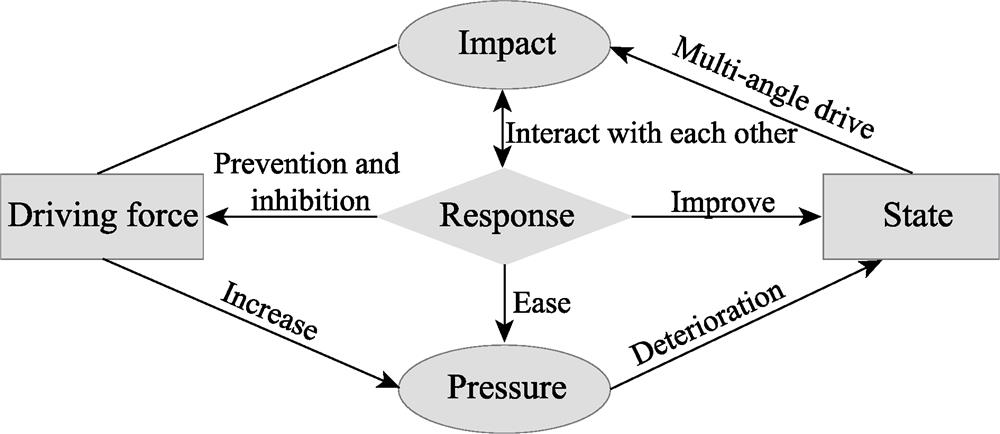
    Fig. 1. DPSIR model as applied to haze governance
    Overall changes in the level and efficiency of urban haze governance in North China from 2007 to 2016
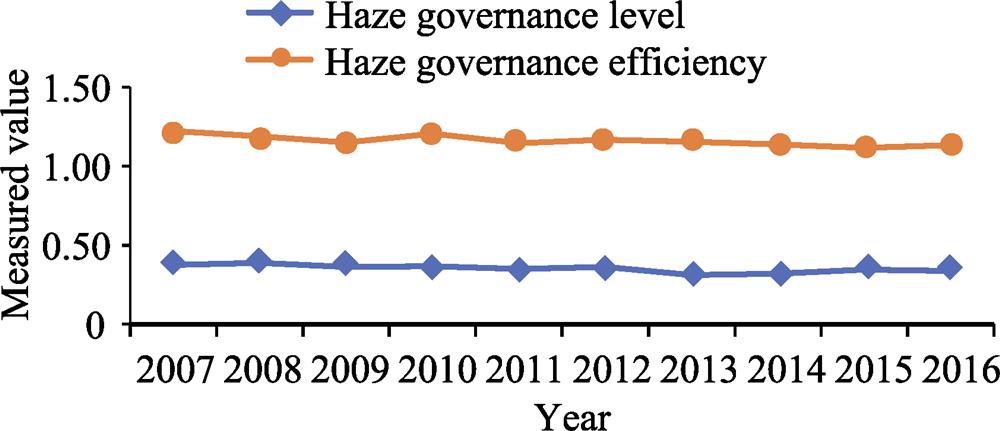
    Fig. 2. Overall changes in the level and efficiency of urban haze governance in North China from 2007 to 2016
    Distribution of urban haze governance level (a) and efficiency (b) in North China from 2007 to 2016
    Fig. 3. Distribution of urban haze governance level (a) and efficiency (b) in North China from 2007 to 2016
    Target layerRule layerIndex layerUnitDirection
    Haze governance levelDriving forceMunicipal public infrastructure investment×104 yuanpositive
    Urban personnel in the management of water conservancy, environment, and public facilities×104 personpositive
    Energy consumption per unit of GDPtons of standard coal (×104 yuan)-1negative
    PressureEffluent dischargetnegative
    Sulfur dioxide emissiontnegative
    Dust dischargetnegative
    StateProportion of secondary industry%negative
    Mean of PM2.5μg m-3negative
    ImpactDomestic tourism revenue×104 yuanpositive
    Comprehensive utilization rate of solid waste%positive
    Green coverage in built-up areas%positive
    ResponseSpending on science and technology as a share of GDP%positive
    Spending on education as a share of GDP%positive
    Number of patent applications granted in different regionsnumberpositive
    Table 1.

    Index system of haze governance level

    Index typePrimary indexSecondary indicatorsUnitDirection
    Input indicatorsCapital investmentMunicipal public infrastructure investment×104 yuanpositive
    Spending on science and technology as a share of GDP%positive
    Spending on education as a share of GDP%positive
    Labor inputUrban personnel in the management of water conservancy, the environment, and public facilities×104 personpositive
    Technology inputNumber of patent applications granted in different regionsnumberpositive
    Resources inputEnergy consumption per unit of GDPtons of standard coal (×104 yuan)-1negative
    Output indicatorsDesirable outputDomestic tourism revenue×104 yuanpositive
    Comprehensive utilization rate of solid waste%positive
    Green coverage in built-up areas%positive
    Undesirable outputIndustrial wastewater dischargetnegative
    Industrial sulfur dioxide emissionstnegative
    Industrial dust emissiontnegative
    PM2.5μg m-3negative
    Table 2.

    Index system of haze governance efficiency

    RegionHaze governance levelHaze governance efficiencyIndifference between rank of level versus efficiency
    2007201020132016MeanRanking for level2007201020132016MeanRanking for efficiency
    Taiyuan0.7360.6960.8710.8550.77711.0421.0661.2121.2791.16516
    Shijiazhuang0.6520.6040.5240.6500.62921.0031.0361.0401.0291.01124
    Hohhot0.4580.4560.3640.4830.47131.3341.4271.3981.1171.4014
    Tangshan0.4850.5100.3390.3420.44841.0231.0331.0221.0130.94526
    Baotou0.4340.4070.3420.3920.41951.2351.3281.1831.2421.21413
    Handan0.4220.4330.3530.3620.40961.0091.0311.0400.7640.96325
    Baoding0.4330.4130.3660.4140.40171.1091.0891.3531.6681.2759
    Qinhuangdao0.4880.3930.3050.4060.38281.6051.2401.2081.0441.2788no change
    Changzhi0.3540.3780.3360.3610.36591.0060.7330.6911.0060.81029
    Datong0.3680.3900.3190.3340.362101.0011.0531.0491.1441.02822
    Ordos0.3280.3790.2760.2480.359111.4681.6721.3451.3641.4373
    Zhangjiakou0.3800.3240.2840.3550.343121.0041.0381.0961.1521.05321
    Jinzhong0.3340.3520.3180.3420.340131.0721.2001.3741.3701.19414
    Xinzhou0.3500.3760.3660.3030.339141.7291.2971.1250.7381.15718
    Langfang0.4640.3730.2580.3580.336151.2801.0491.0691.0911.08820
    Hulun Buir0.3120.3210.2820.2890.327162.2512.3941.9551.2111.9121
    Chifeng0.3890.3310.2660.3230.321171.3611.1381.1351.2061.17015
    Linfen0.3300.3520.2900.2990.319181.0391.0530.7210.7010.83928
    Chengde0.3620.3300.2640.3190.316191.0121.0941.2121.1041.15917
    Lvliang0.2850.3200.3140.3130.313201.3981.0580.7251.0011.13819
    Jincheng0.3290.3150.2870.2610.309211.0801.0071.0181.0491.02623
    Ulanqab0.2900.2770.2510.2480.282221.8351.2241.4731.7481.5802
    Xingtai0.3090.3050.2110.2960.275231.0841.0481.0030.5620.86527
    Wuhai0.2900.3050.2570.3060.273241.5911.2381.3191.3181.2837
    Cangzhou0.3330.2810.2070.2710.269251.3891.5771.0781.0291.24911
    Yuncheng0.2740.2610.2580.2420.264260.4941.0100.6641.0010.79931
    Shuozhou0.2510.2700.2580.1960.256271.3901.2481.3281.2361.3455
    Yangquan0.2850.3020.2270.2100.255281.1061.1321.2511.2321.26310
    Bayan Nur0.2570.3530.2320.2250.255291.0081.4731.1391.1171.21612
    Tongliao0.2810.3030.2290.2190.252300.6621.1821.0810.8400.80830no change
    Hengshui0.2980.2560.1770.2370.222311.2681.1371.4591.7451.3236
    Hebei0.4210.3840.2990.3650.3661.1621.1251.1441.1091.110
    Shanxi0.3540.3650.3490.3380.3541.1231.0781.0141.0691.069
    Inner Mongolia0.3380.3480.2780.3040.3291.4161.4531.3371.2401.336
    North China0.3730.3670.3110.3370.3511.2221.2031.1541.1331.161
    Table 3.

    Comparisons of haze governance level and efficiency for 31 cities in North China

    VariableVariable nameUnitObservationsMeanS.D.Minimum valueMaximum value
    hglHaze governance level-3100.350.120.1770.87
    hgeHaze governance efficiency-3101.160.310.4842.66
    pgdpGDP per capitayuan person-131048973.9946015.478395371725
    isProportion of secondary industry%31051.748.3027.8773.71
    fdiActual utilization of foreign capital×104 yuan3102280002450001328.461300000
    dsPopulation densityperson km-23104467.283429.0624812968
    jsProportion of construction land in urban area%31013.1514.210.6797.18
    Table 4.

    Descriptive statistics of the main variables

    Variablesln hglln hge
    Regression coefficientT statisticRegression coefficientT statistic
    C0.2759**2.350.46420.74
    ln pgdp-0.0141***-3.48-0.0786***-3.63
    ln is0.0530**2.190.12640.98
    ln fdi-0.0067**-2.150.01741.04
    ln ds0.00521.09-0.0125-0.49
    ln js-0.0008-0.14-0.0604**-2.02
    R20.09350.0723
    F-statistic5.654.27
    Prob(F-statistic)0.00000.0000
    N310310
    Table 5.

    Analysis of factors affecting the level and efficiency of haze governance

    Qinlin XIAO, Chao TIAN, Yanjun WANG, Xiuqing LI, Liming XIAO. Measurement and Comparison of Urban Haze Governance Level and Efficiency based on the DPSIR Model: A Case Study of 31 Cities in North China[J]. Journal of Resources and Ecology, 2020, 11(6): 549
    Download Citation