
Qinlin XIAO, Chao TIAN, Yanjun WANG, Xiuqing LI, Liming XIAO. Measurement and Comparison of Urban Haze Governance Level and Efficiency based on the DPSIR Model: A Case Study of 31 Cities in North China[J]. Journal of Resources and Ecology, 2020, 11(6): 549
- Journal of Resources and Ecology
- Vol. 11, Issue 6, 549 (2020)
Abstract
1 Introduction
Maintaining environmental integrity is critical to a culture (
The formation of hazy weather results from the joint action of various factors. Studies have found that the concentration and accumulation of atmospheric pollutants and meteorological triggers are the main drivers of haze (
In summary, although previous studies have made beneficial explorations of haze treatment, the corresponding quantitative research is lacking in most theories. Only a few scholars have measured the level of haze management and the governance indexes that are less involved in governance efficiency. Comparisons based on spatial differences and factors influencing the haze management level and management efficiency are few. The ultimate goal of haze governance is to achieve economic, social, and environmental coordination while improving the quality of urban air. If increasing the investment in governance is the only focus, while neglecting the efficiency of governance, it may eventually lead to the inefficiency of the inputs and outputs of such an approach to governance. Therefore, when measuring and evaluating haze governance, we should not only consider its governance level but also pay attention to its governance efficiency. In addition, as a typical region of haze pollution in China, North China has more days of heavy pollution in winter, which seriously threatens people's physical and mental health. Thus, investigating the governance status of haze is necessary.
In general, common comprehensive evaluation methods include the entropy weight method, analytic hierarchy process, and the fuzzy evaluation method (
On this basis, this paper uses 2007-2016 panel data for 31 cities in North China as samples. Based on the fact that the DPSIR model constructed a haze index system of governance and governance efficiency, the entropy value method and the super-efficiency data envelope-analysis (DEA) model are used to measure these two components. Then, they are compared from the aspects of spatial differences and effects to comprehensively evaluate haze governance. Some feasible policies and suggestions are then put forward, encouraging further research on haze governance.
2 Research methods
2.1 DPSIR model
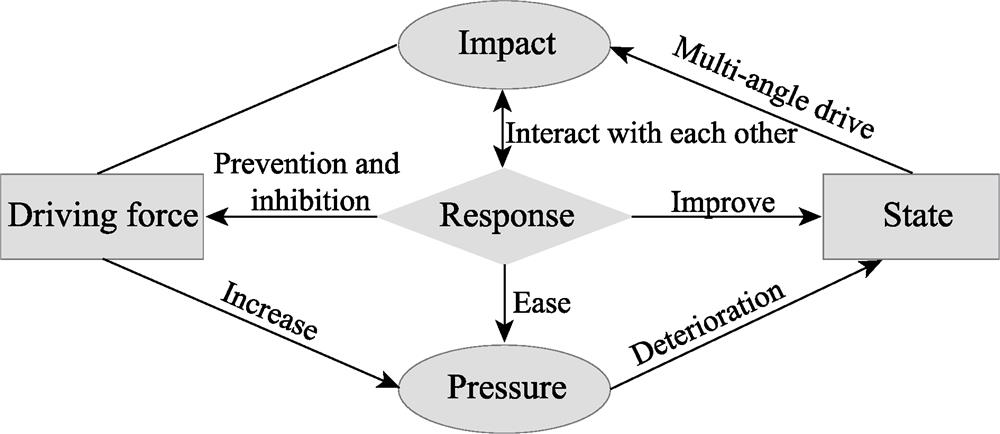
To comprehensively evaluate the haze governance of cities in North China, this paper uses the DPSIR model to carry out the haze governance evaluation at the city level. The driving force, pressure, state, influence, response, and other dimensions in the model constitute a complete causal chain. Specifically, from the perspective of haze governance, the causal relationship in the DPSIR model is shown as the driving force that is powering the engine of haze governance. Pressure will have a negative effect on haze governance. The state plays a two-way role in haze governance, with positive and negative effects. The influences and responses of haze governance have an interactive coupling relationship, in that they interact and influence each other. In addition, the response can positively influence the driving force, stress, and state through inhibition, mitigation, and improvement (
![]()
Figure 1.
2.2 Entropy method
The entropy method is an objective evaluation method of weight assignment. It can achieve dimensionality reduction by calculating the weight of each index, and provide a basis for multi-index evaluation. The specific steps are as follows.
1) The initial matrix ${{\{{{x}_{ijk}}\}}_{m\times n}}$ is constructed, where
2) To eliminate the influence of different dimensions, the data for each index are standardized. Considering that the normalized data might be zero, all values are shifted to the right by
3) The proportion of the index value of city
4) The information entropy of index
5) The weight of index
6) The comprehensive score of each city is then calculated as:
On this basis, the relevant index data for 31 prefecture-level cities in North China were processed to obtain a comprehensive score of the haze governance level.
2.3 Super-efficiency DEA model
Efficiency measurement mainly involves parametric and non-parametric methods, namely, DEA and stochastic frontier analysis (SFA). SFA needs to set a production function in advance and has limitations in dealing with the problem of “multi-input and multi-output”. However, DEA can effectively compensate for this deficiency because of various advantages, such as no need to set the form of a production function, non-subjective weighting, and no requirement for index dimensions, making the measurement results more aligned with the objective reality. As a result, DEA is widely used at present. First proposed by
In the formula,${{\theta }_{se}}$is the relative efficiency value of each decision-making unit, while
2.4 Panel econometric model
To explore and compare the action mechanisms of haze governance level and efficiency, this paper further established a panel metering model. First, it chose between the variable intercept panel data model and the mixed data panel model, as determined mainly by the Chow and F tests. If the null hypothesis was rejected, the model would be changed to the variable intercept panel model. On this basis, the Hausman test is also needed to determine whether to use the random effect or the fixed effect model, according to the formula:
In the formula, ${{y}_{i}}_{t}$ represents the explained variable. To compare the differences of the influencing mechanisms between haze treatment and efficiency, this paper takes the haze treatment level and efficiency as the explained variables, respectively, to investigate the significance of each influencing factor. ${{\alpha }_{0}}$ is the intercept term of the model. $x{{1}_{it}},x{{2}_{it}},\cdots ,x{{9}_{it}}$ is the explanatory variable, respectively corresponding to the specific index values of each dimension of the DPSIR model. ${{\beta }_{1}},{{\beta }_{2}},\cdots ,{{\beta }_{9}}$ is the regression coefficient of each explanatory variable. ${{u}_{i}}$ is the individual fixed effect term, ${{v}_{t}}$ is the time-point fixed effect term, and ${{\varepsilon }_{it}}$ is the random disturbance term, which obeys the independently identical distribution.
3 Evaluation system construction and data source
3.1 Index system of haze governance level
Haze governance refers to the governance activities of relevant stakeholders to reduce the hazards of hazy weather by adopting a series of environmental protection measures. From this perspective, quantitative indicators of environmental governance with similar connotations and relatively wider scope can provide reference values for the selection of haze governance indicators (
| Target layer | Rule layer | Index layer | Unit | Direction |
|---|---|---|---|---|
| Haze | Driving force | Municipal public infrastructure investment | ×104 yuan | positive |
| Urban personnel in the management of water conservancy, | ×104 person | positive | ||
| Energy consumption per unit of GDP | tons of standard coal | negative | ||
| Pressure | Effluent discharge | t | negative | |
| Sulfur dioxide emission | t | negative | ||
| Dust discharge | t | negative | ||
| State | Proportion of secondary industry | % | negative | |
| Mean of PM2.5 | μg m-3 | negative | ||
| Impact | Domestic tourism revenue | ×104 yuan | positive | |
| Comprehensive utilization rate of solid waste | % | positive | ||
| Green coverage in built-up areas | % | positive | ||
| Response | Spending on science and technology as a share of GDP | % | positive | |
| Spending on education as a share of GDP | % | positive | ||
| Number of patent applications granted in different regions | number | positive |
Table 1.
Index system of haze governance level
Driving force (D): Driving force is the driving factor that induces the practice of haze governance, and mainly involves economic and social drivers. In terms of economic drivers, this paper believes that the increase in investment in environmental infrastructure can provide funds and guarantee the implementation of haze governance. However, obtaining the index data for environmental infrastructure investment that is limited to the city level is difficult. Thus, municipal public infrastructure investment is chosen to serve as an approximate replacement. The increase in full-time environmental protection personnel driven by society and energy consumption per unit GDP are also key factors for haze governance. On the one hand, the increase in full-time environmental protection personnel provides high-quality environmental protection talents for haze governance. On the other hand, the scale of energy consumption is an important factor in promoting haze governance in various regions. Therefore, this paper further chooses urban personnel and energy consumption per unit GDP in water conservancy, the environment, and public facility management to represent the driving force at the social level.
Pressure (P): Pressure reflects the load of haze governance activities on the environment, mainly the discharge of selected pollutants. Based on the research of
Status (S): Status refers to the status of haze governance under the above forces and pressures, which can be used to quantitatively calculate the current status of haze governance in each city. Based on the research of
Impact (I): Impact refers to the impact on the urban economic and social development and the ecological environment caused by the haze governance activities. In terms of the economy, various cities have improved local air quality by carrying out haze government practices, enabling a large number of tourists to travel to the local areas leading to an increase in local tourism income. Therefore, this paper refers to
Response (R): Response refers to positive measures and countermeasures implemented by individuals, groups, or governments that are conducive to haze governance activities. This paper believes that improving the science and technology level and the quality of environmental protection personnel are important factors for the smooth development of haze governance activities. Therefore, by referring to relevant studies (
3.2 Index system of haze governance efficiency
To scientifically measure the conversion efficiency of the inputs in haze governance, and on the basis of following the principles comparable to the level of haze governance (as described above), this paper selects the relevant indexes for each dimension in the DPSIR model. It then establishes the input-output evaluation index system of haze governance efficiency based on the input-output perspective and the knowledge production function (
The output index of haze governance is the same as that in existing efficiency evaluation research (
| Index type | Primary index | Secondary indicators | Unit | Direction |
|---|---|---|---|---|
| Input indicators | Capital investment | Municipal public infrastructure investment | ×104 yuan | positive |
| Spending on science and technology as a share of GDP | % | positive | ||
| Spending on education as a share of GDP | % | positive | ||
| Labor input | Urban personnel in the management of water conservancy, the environment, and public facilities | ×104 person | positive | |
| Technology input | Number of patent applications granted in different regions | number | positive | |
| Resources input | Energy consumption per unit of GDP | tons of standard coal (×104 yuan)-1 | negative | |
| Output indicators | Domestic tourism revenue | ×104 yuan | positive | |
| Comprehensive utilization rate of solid waste | % | positive | ||
| Green coverage in built-up areas | % | positive | ||
| Undesirable output | Industrial wastewater discharge | t | negative | |
| Industrial sulfur dioxide emissions | t | negative | ||
| Industrial dust emission | t | negative | ||
| PM2.5 | μg m-3 | negative |
Table 2.
Index system of haze governance efficiency
3.3 Data source
This article uses North China for the study area, where haze pollution is more serious. According to the administrative divisions, this area includes Beijing, Tianjin, Hebei, Shanxi, and Inner Mongolia. A total of 31 cities are used as the basic spatial units of analysis: Taiyuan, Datong, Shuozhou, Yangquan, Changzhi, Jincheng, Jinzhong, Yuncheng, Xinzhou, Linfen, Lvliang, Shijiazhuang, Tangshan, Qinhuangdao, Handan, Xingtai, Baoding, Zhangjiakou, Chengde, Cangzhou, Langfang, Hengshui, Hohhot, Baotou, Wuhai, Tongliao, Chifeng, Ordos, Hulun Buir, Bayan Nur, and Ulanqab.
Relevant data are mainly from the
4 Results and analysis
4.1 Overall evaluation of the level and efficiency of urban haze governance in North China
Based on the entropy method and the super-efficiency DEA model, this paper calculates the haze governance level and efficiency of 31 prefecture-level cities in North China from 2007 to 2016. For the haze governance efficiency, we select the super-SBM model with a constant return to scale based on the relevant data of the input and output indexes listed in
![]()
Figure 2.
| Region | Haze governance level | Haze governance efficiency | Indifference between rank | ||||||||||||||||||||||||
|---|---|---|---|---|---|---|---|---|---|---|---|---|---|---|---|---|---|---|---|---|---|---|---|---|---|---|---|
| 2007 | 2010 | 2013 | 2016 | Mean | Ranking for level | 2007 | 2010 | 2013 | 2016 | Mean | Ranking for efficiency | ||||||||||||||||
| Taiyuan | 0.736 | 0.696 | 0.871 | 0.855 | 0.777 | 1 | 1.042 | 1.066 | 1.212 | 1.279 | 1.165 | 16 | ↑ | ||||||||||||||
| Shijiazhuang | 0.652 | 0.604 | 0.524 | 0.650 | 0.629 | 2 | 1.003 | 1.036 | 1.040 | 1.029 | 1.011 | 24 | ↑ | ||||||||||||||
| Hohhot | 0.458 | 0.456 | 0.364 | 0.483 | 0.471 | 3 | 1.334 | 1.427 | 1.398 | 1.117 | 1.401 | 4 | ↑ | ||||||||||||||
| Tangshan | 0.485 | 0.510 | 0.339 | 0.342 | 0.448 | 4 | 1.023 | 1.033 | 1.022 | 1.013 | 0.945 | 26 | ↑ | ||||||||||||||
| Baotou | 0.434 | 0.407 | 0.342 | 0.392 | 0.419 | 5 | 1.235 | 1.328 | 1.183 | 1.242 | 1.214 | 13 | ↑ | ||||||||||||||
| Handan | 0.422 | 0.433 | 0.353 | 0.362 | 0.409 | 6 | 1.009 | 1.031 | 1.040 | 0.764 | 0.963 | 25 | ↑ | ||||||||||||||
| Baoding | 0.433 | 0.413 | 0.366 | 0.414 | 0.401 | 7 | 1.109 | 1.089 | 1.353 | 1.668 | 1.275 | 9 | ↑ | ||||||||||||||
| Qinhuangdao | 0.488 | 0.393 | 0.305 | 0.406 | 0.382 | 8 | 1.605 | 1.240 | 1.208 | 1.044 | 1.278 | 8 | no change | ||||||||||||||
| Changzhi | 0.354 | 0.378 | 0.336 | 0.361 | 0.365 | 9 | 1.006 | 0.733 | 0.691 | 1.006 | 0.810 | 29 | ↑ | ||||||||||||||
| Datong | 0.368 | 0.390 | 0.319 | 0.334 | 0.362 | 10 | 1.001 | 1.053 | 1.049 | 1.144 | 1.028 | 22 | ↑ | ||||||||||||||
| Ordos | 0.328 | 0.379 | 0.276 | 0.248 | 0.359 | 11 | 1.468 | 1.672 | 1.345 | 1.364 | 1.437 | 3 | ↓ | ||||||||||||||
| Zhangjiakou | 0.380 | 0.324 | 0.284 | 0.355 | 0.343 | 12 | 1.004 | 1.038 | 1.096 | 1.152 | 1.053 | 21 | ↑ | ||||||||||||||
| Jinzhong | 0.334 | 0.352 | 0.318 | 0.342 | 0.340 | 13 | 1.072 | 1.200 | 1.374 | 1.370 | 1.194 | 14 | ↑ | ||||||||||||||
| Xinzhou | 0.350 | 0.376 | 0.366 | 0.303 | 0.339 | 14 | 1.729 | 1.297 | 1.125 | 0.738 | 1.157 | 18 | ↑ | ||||||||||||||
| Langfang | 0.464 | 0.373 | 0.258 | 0.358 | 0.336 | 15 | 1.280 | 1.049 | 1.069 | 1.091 | 1.088 | 20 | ↑ | ||||||||||||||
| Hulun Buir | 0.312 | 0.321 | 0.282 | 0.289 | 0.327 | 16 | 2.251 | 2.394 | 1.955 | 1.211 | 1.912 | 1 | ↓ | ||||||||||||||
| Chifeng | 0.389 | 0.331 | 0.266 | 0.323 | 0.321 | 17 | 1.361 | 1.138 | 1.135 | 1.206 | 1.170 | 15 | ↓ | ||||||||||||||
| Linfen | 0.330 | 0.352 | 0.290 | 0.299 | 0.319 | 18 | 1.039 | 1.053 | 0.721 | 0.701 | 0.839 | 28 | ↑ | ||||||||||||||
| Chengde | 0.362 | 0.330 | 0.264 | 0.319 | 0.316 | 19 | 1.012 | 1.094 | 1.212 | 1.104 | 1.159 | 17 | ↓ | ||||||||||||||
| Lvliang | 0.285 | 0.320 | 0.314 | 0.313 | 0.313 | 20 | 1.398 | 1.058 | 0.725 | 1.001 | 1.138 | 19 | ↓ | ||||||||||||||
| Jincheng | 0.329 | 0.315 | 0.287 | 0.261 | 0.309 | 21 | 1.080 | 1.007 | 1.018 | 1.049 | 1.026 | 23 | ↑ | ||||||||||||||
| Ulanqab | 0.290 | 0.277 | 0.251 | 0.248 | 0.282 | 22 | 1.835 | 1.224 | 1.473 | 1.748 | 1.580 | 2 | ↓ | ||||||||||||||
| Xingtai | 0.309 | 0.305 | 0.211 | 0.296 | 0.275 | 23 | 1.084 | 1.048 | 1.003 | 0.562 | 0.865 | 27 | ↑ | ||||||||||||||
| Wuhai | 0.290 | 0.305 | 0.257 | 0.306 | 0.273 | 24 | 1.591 | 1.238 | 1.319 | 1.318 | 1.283 | 7 | ↓ | ||||||||||||||
| Cangzhou | 0.333 | 0.281 | 0.207 | 0.271 | 0.269 | 25 | 1.389 | 1.577 | 1.078 | 1.029 | 1.249 | 11 | ↓ | ||||||||||||||
| Yuncheng | 0.274 | 0.261 | 0.258 | 0.242 | 0.264 | 26 | 0.494 | 1.010 | 0.664 | 1.001 | 0.799 | 31 | ↑ | ||||||||||||||
| Shuozhou | 0.251 | 0.270 | 0.258 | 0.196 | 0.256 | 27 | 1.390 | 1.248 | 1.328 | 1.236 | 1.345 | 5 | ↓ | ||||||||||||||
| Yangquan | 0.285 | 0.302 | 0.227 | 0.210 | 0.255 | 28 | 1.106 | 1.132 | 1.251 | 1.232 | 1.263 | 10 | ↓ | ||||||||||||||
| Bayan Nur | 0.257 | 0.353 | 0.232 | 0.225 | 0.255 | 29 | 1.008 | 1.473 | 1.139 | 1.117 | 1.216 | 12 | ↓ | ||||||||||||||
| Tongliao | 0.281 | 0.303 | 0.229 | 0.219 | 0.252 | 30 | 0.662 | 1.182 | 1.081 | 0.840 | 0.808 | 30 | no change | ||||||||||||||
| Hengshui | 0.298 | 0.256 | 0.177 | 0.237 | 0.222 | 31 | 1.268 | 1.137 | 1.459 | 1.745 | 1.323 | 6 | ↓ | ||||||||||||||
| Hebei | 0.421 | 0.384 | 0.299 | 0.365 | 0.366 | Ⅰ | 1.162 | 1.125 | 1.144 | 1.109 | 1.110 | Ⅱ | ↑ | ||||||||||||||
| Shanxi | 0.354 | 0.365 | 0.349 | 0.338 | 0.354 | Ⅱ | 1.123 | 1.078 | 1.014 | 1.069 | 1.069 | Ⅲ | ↑ | ||||||||||||||
| Inner Mongolia | 0.338 | 0.348 | 0.278 | 0.304 | 0.329 | Ⅲ | 1.416 | 1.453 | 1.337 | 1.240 | 1.336 | Ⅰ | ↓ | ||||||||||||||
| North China | 0.373 | 0.367 | 0.311 | 0.337 | 0.351 | ‒ | 1.222 | 1.203 | 1.154 | 1.133 | 1.161 | ‒ | ‒ | ||||||||||||||
Table 3.
Comparisons of haze governance level and efficiency for 31 cities in North China
4.2 Spatial differences of urban haze governance level and efficiency in North China
Exploring the spatial differences in the level and efficiency of haze governance in cities in North China is helpful for understanding the spatial distribution law of the two, which is of great significance for targeted haze governance work. In this paper, based on the calculated mean values of the two during the investigation period, ArcGIS 10.2 software was used to express the spatial visualization (
![]()
Figure 3.
The spatial pattern of haze governance levels in various cities in North China during the investigation period shows low levels in the east, high in the middle, and low in the west (
4.3 Analysis of factors affecting the level and efficiency of urban haze governance in North China
Through the analysis of relevant literature on haze pollution (
(1) Economic growth (
(2) Industrial structure (
(3) Level of openness (
(4) Population density (
(5) Urban built-up area ratio (
It should be noted that the original data of the above socio-economic indicators are all from China Urban Statistics Yearbook, China Urban and Rural Construction Statistics Yearbook and China Regional Economic Statistics Yearbook. The descriptive statistical analysis of each variable is shown in
| Variable | Variable name | Unit | Observations | Mean | S.D. | Minimum value | Maximum value |
|---|---|---|---|---|---|---|---|
| Haze governance level | - | 310 | 0.35 | 0.12 | 0.177 | 0.87 | |
| Haze governance efficiency | - | 310 | 1.16 | 0.31 | 0.484 | 2.66 | |
| GDP per capita | yuan person-1 | 310 | 48973.99 | 46015.47 | 8395 | 371725 | |
| Proportion of secondary industry | % | 310 | 51.74 | 8.30 | 27.87 | 73.71 | |
| Actual utilization of foreign capital | ×104 yuan | 310 | 228000 | 245000 | 1328.46 | 1300000 | |
| Population density | person km-2 | 310 | 4467.28 | 3429.06 | 248 | 12968 | |
| Proportion of construction land in urban area | % | 310 | 13.15 | 14.21 | 0.67 | 97.18 |
Table 4.
Descriptive statistics of the main variables
To eliminate heteroscedasticity, a logarithmic transformation is applied to each variable1. Before panel regression, the applicability of the model should be tested first. Here, the Chow and Hausman tests indicated that selecting the individual fixed-effect variable-intercept panel data model is reasonable. Furthermore, regression was performed with Stata 15.1 software (
| Variables | ln | ln | ||
|---|---|---|---|---|
| Regression coefficient | Regression coefficient | |||
| 0.2759** | 2.35 | 0.4642 | 0.74 | |
| ln | -0.0141*** | -3.48 | -0.0786*** | -3.63 |
| ln | 0.0530** | 2.19 | 0.1264 | 0.98 |
| ln | -0.0067** | -2.15 | 0.0174 | 1.04 |
| ln | 0.0052 | 1.09 | -0.0125 | -0.49 |
| ln | -0.0008 | -0.14 | -0.0604** | -2.02 |
| 0.0935 | 0.0723 | |||
| 5.65 | 4.27 | |||
| Prob( | 0.0000 | 0.0000 | ||
| 310 | 310 | |||
Table 5.
Analysis of factors affecting the level and efficiency of haze governance
(1) Among the indicators of economic growth (ln
(2) For the index of industrial structure (ln
(3) Regarding the level of opening to the outside world index (ln
(4) For the index of population density (ln
(5) As for the proportion of construction land area (ln
5 Conclusions
Haze governance is an important way to transform China’s approach to ecological governance and a key link in environmental protection. Based on the DPSIR model using data from 31 cities in North China from 2007 to 2016, the haze management level and efficiency show the following characteristics. 1) In North China cities, haze management level and efficiency show a wave of decline overall, with obvious characteristics of different stages. The haze governance level marked a turning point before the governance efficiency, the governance efficiency is far higher than the level of management, and it achieved the DEA effective state, guaranteeing haze governance efficiency in the future. Thus, the level of haze governance should be a major focus of the cities of North China. 2) Significant spatial differences occur in haze governance level and efficiency. The haze governance level presents a convex distribution pattern of “east low-middle high-west low,” whereas haze governance efficiency presents a concave distribution pattern of “east high-middle low-west high.” The number of cities with moderate level in haze governance is significantly higher than the number with moderate level. 3) The effects of various factors on haze governance level and efficiency are not the same. Among these factors, economic growth and the level of opening to the outside world have significant negative effects hindering haze governance, whereas industrial structure has significant positive effects promoting it. However, economic growth and the proportion of construction land have significant negative effects on haze governance efficiency.
On these bases, the following suggestions are proposed.
First, considering that the haze governance level and the overall governance efficiency are not high, cities should continue to optimize their industrial structure based on supply-side structural reform in the future and promote the transformation of the economic development mode to an intensive and ecological process. Therefore, each stakeholder should adopt active and effective adjustments to fundamentally curb the trend of increasing haze pollution. We will establish and improve a governance community featuring government supervision, self-inspection by enterprises and public supervision by the media, accelerate the transformation from a single governance model dominated by the government, and ensure that all parties participate and coordinate in the governance. These steps will also create a new situation of public co-governance featuring “breathing together and striving together,” and we will attempt to make the inflection points of the governance level and efficiency appear in advance.
Second, according to the spatial distribution characteristics of the haze governance level and efficiency, cities should strengthen mutual cooperation in the future, establish a regional joint prevention and control mechanism, and form a broad united front for environmental protection. The key is to promote the core technology of air pollution reduction, strengthen regional scientific research cooperation and exchanges, focus on energy conservation and emissions reduction technology research and development, establish effective punishments, and set the admittance threshold for enterprises of research and development of environmental protection facilities and high pollution. These steps will minimize the haze governance cost, ultimately achieving the control of compound haze pollution. Each city should also clarify the governance responsibilities, establish unified regional environmental management laws and regulations, and improve the ecological and environmental compensation mechanism. We will improve the joint prevention and early warning mechanisms for environmental pollution. Thus, when problems arise, cities can cooperate and form a synergy that is conducive to effective haze governance.
Third, according to the results of the analysis of various dimensions of DPSIR, the level and efficiency of haze treatment can be improved in the future in terms of driving force, pressure, state, impact, and response. Specific measures include the following. 1) Cities should be based on green development targets which include the transformation of the mode of their economic development. In particular, places such as Shanxi and Inner Mongolia with coal resource-based provinces should be prioritized, actively promoting the green transformation of their industrial structures. Economic development through innovative modes boosts the green transformation of local economic development, so that the haze promotes the efficiency of governance and provides economic support, helping to move the city over the EKC inflection point. 2) Top priorities include increasing investments in pollution prevention and control as well as research and development of clean technologies and using government research and development funds to shift to research and development of haze governance technologies. At the same time, active responses to the “The Belt and Road” initiative and stepped up foreign direct investment should allow these cities to better reflect the “halo effect of pollution.” We also need to effectively adjust and optimize the mix of energy consumption and encourage the development of green, clean, and renewable energy sources as alternatives to traditional sources of energy, mainly coal. Supplementary economic measures should be adopted, when necessary, to speed up the green adjustment of the energy consumption structure. These measures include the collection of a resource tax on coal, a carbon tax, an environmental tax, and an emissions tax. 3) Each city should carry out energy conservation and emission reduction activities according to its own real situation for reducing pollutant emission and improving energy efficiency. For example, relevant departments can recommend the use of smart power terminals and conduct research and development on new materials to improve the insulation effect of buildings and achieve the emission reduction targets. We actively advocate low-carbon lifestyles such as “green travel” and “public transport” and promote emission reduction. 4) In areas where the population density is concentrated, attention should be paid to the professional skills training of environmental protection administrators so that they can further serve the work of haze governance.
References
[1] Bai JH, NieL. Is environmental decentralization really exacerbating haze pollution?. China Population, Resources and Environment, 27, 59-69(2017).
[3] CaoX, YuJ. Regional innovation efficiency in China from the green low-carbon perspective. China Population, Resources and Environment, 25, 10-19(2015).
[5] ChenG. The competition for FDI, environmental regulation, and pollution haven. World Economy Study, 45-89(2009).
[6] Chen LL, Jin LH. An improved fuzzy comprehensive evaluation method of eutrophication for lakes and reservoirs. China Environmental Science, 34, 3223-3229(2014).
[7] Chen SY, Wang JM. Evaluation and policy innovation of urban haze governance in China: Taking the Yangtze River Delta Area as an example. China Population, Resources and Environment, 28, 71-80(2018).
[9] Chu ZP, Liu CX, ZhuJ. Evolutionary game analysis on cooperative governance of haze in Beijing-Tianjin-Hebei based on the logic of collective action. China Population, Resources and Environment, 27, 56-65(2017).
[10] Dong XH, Hu YL, Li WX. A international comparisons and historical analysis on China’s environmental governance efficiency: Based on the model of DEA. Studies in Science of Science, 26, 1221-1230(2008).
[11] FuP. The realistic path choice of urban haze management in the New Normal. Manage World, 34, 179-180(2018).
[12] Fang YL, Huang ZF, ZhangH et al. The asynchronous phenomenon and relative efficiency of tourism resources in China: Taking the 31 provinces’ panel data from 2001 to 2009 for an example. Journal of Natural Resources, 5, 280-288(2014).
[13] GanT, Wang ZL. Measurement on the efficiency of urban environment governance in the Yangtze River Delta Area. Urban Problems, 81-88(2018).
[14] Hao GC, Xu YL, Zhang XM et al. Spillover effect and decomposition of green economic performance of the city in the Yangtze River Economic Belt. China Population, Resources and Environment, 28, 75-83(2018).
[16] Jiang CH, Song ZY, FengZ. Haze governance and it’s economic and social effect: An analysis of CGE model based on “Coal Restricted Area” policy. China Industrial Economics, 44-62(2017).
[18] Meng QG, Du HT, Wang JZ. The analysis of local governments’ behavior in haze control from the perspective of interest demand. China Soft Science, 66-76(2017).
[19] Shi QL, GuoF, Chen SY. “Political Blue Sky” in fog and haze governance — Evidence from the local annual “Two Sessions” in China. China Industrial Economics, 40-56(2016).
[22] Tong YF, Wang YY. The interaction mechanism of urban population and haze in China. Social Sciences of Beijing, 4-10(2014).
[23] Wang JM, Yang WP, YangL. Estimation of China’s energy structure adjustment with the win-win goal constraints. China Population, Resources and Environment, 26, 27-36(2016).
[24] WangB, HaoF. Innovations in legislation on haze environmental responsibility: Perspective of modern environmental responsibility. China Soft Science, 1-8(2015).
[25] WangQ, Li HF, Ao JH. Research on the evaluation index system of smog governance mechanism through Beijing-Tianjin-Hebei tripartite linkage. Contemporary Economy & Management, 40, 25-31(2018).
[26] WangQ, GuoF, Xu XY et al. The evaluation of urban environmental governance efficiency of China and its temporal-spatial changes study. World Regional Studies, 21, 153-162(2012).
[27] Wang SJ, GaoS, ChenJ. Spatial heterogeneity of driving factors of urban haze pollution in China based on GWR model. Geographical Research, 39, 651-668(2020).
[28] Yu BH, Lu CH. Application of DPSIR framework for analyses of sustainable agricultural development. China Population, Resources and Environment, 68-72(2004).
[29] Zhang LJ, LiN, Qin YC et al. The low-carbon city evaluation and its spatial differentiation based on the DPSIR. World Regional Studies, 28, 85-94(2019).
[30] Zhang JQ, ZhangL, WangS et al. Study on regional sustainable development efficiency measurement and influencing factors: Based on DPSIR-DEA Model. China Population, Resources and Environment, 27, 1-9(2017).
[31] Zhou WJ, Liu WL. Haze governance from the ecological civilization perspective. Journal of Xinjiang University: Philosophy, Humanities & Social Sciences, 44, 30-35(2016).
[32] Zhou ZQ, Xia NX, Liang WG. FDI, independent innovation and haze pollution: Evidence from China. R&D Management, 31, 82-94(2019).


Set citation alerts for the article
Please enter your email address

© Copyright 2018-2021 | Chinese Laser Press. All Rights Reserved 沪ICP备15018463号-20