
Qingbo Zhang, Xiaohui Zhang, Hongwei Han. Optimization of Underwater Photoelectric Image Quality Based on Deep Convolutional Neural Networks[J]. Acta Optica Sinica, 2018, 38(11): 1110004
- Acta Optica Sinica
- Vol. 38, Issue 11, 1110004 (2018)
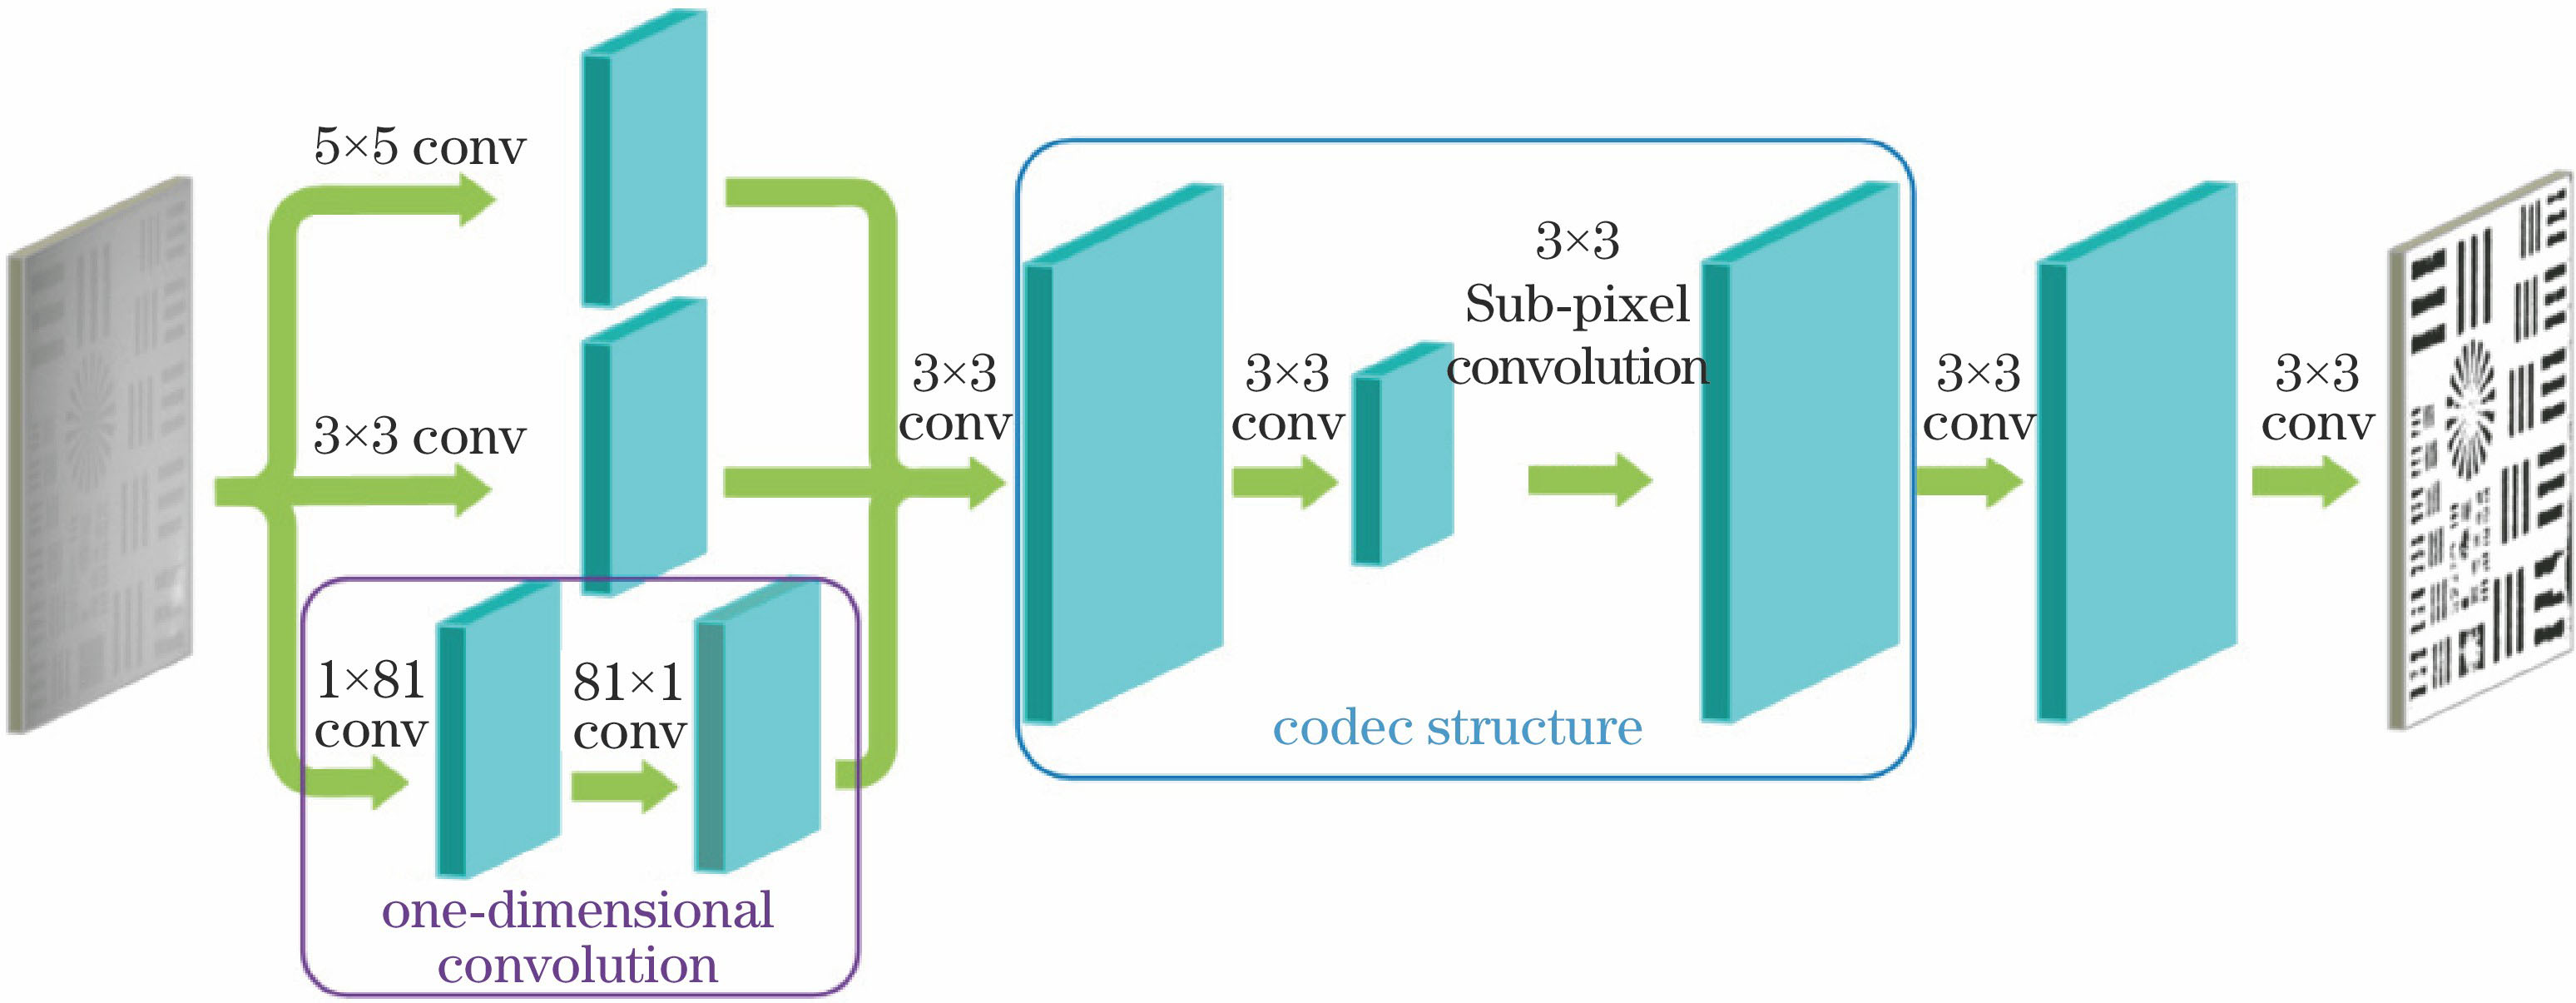
Fig. 1. Network structure
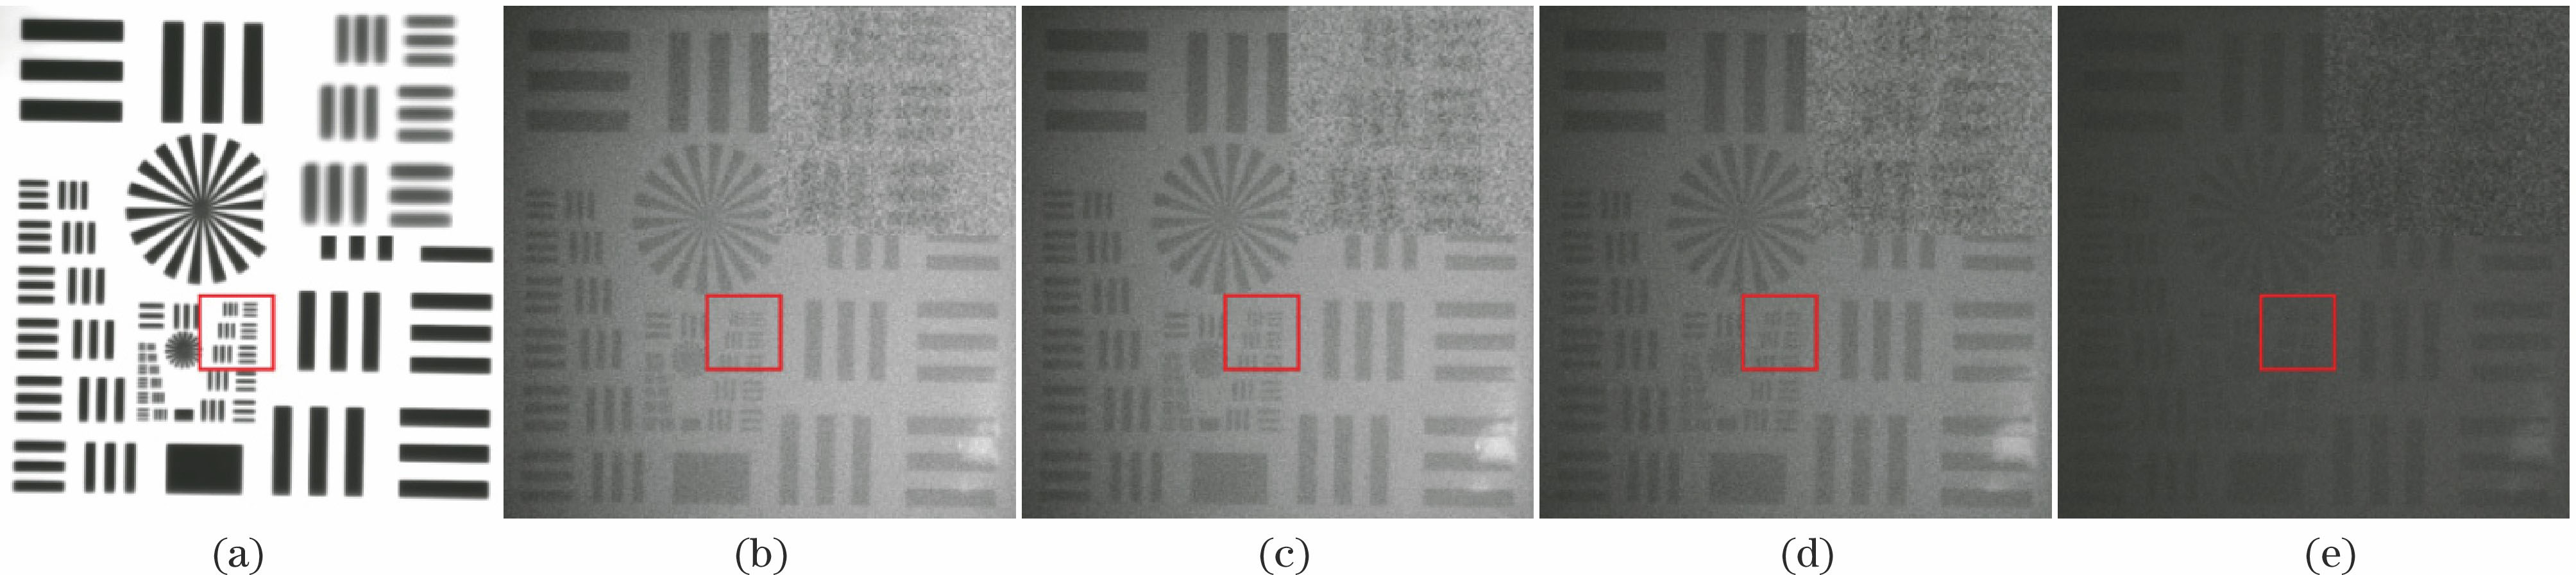
Fig. 2. Images of test board 1 under different illuminations. (a) Target 1 in the clear water; (b) 21.614l lx; (c) 13.826 lx; (d) 6.947 lx; (e) 0.925 lx
Fig. 3. Comparison of before and after preprocessing in fresh water. (a) Before degradation; (b) after degradation; (c) preprocessing
Fig. 4. Relation between initial learning rates and loss function values
Fig. 5. Influence of the skip connection on the restoration effect. (a) Without one-dimensional convolution; (b) with one-dimensional convolution
Fig. 6. Effect of the one-dimensional convolution on the loss function values
Fig. 7. Effect of the sub-pixel convolution on the enhancement of underwater photoelectric image
Fig. 8. Effect of the sub-pixel convolution on the loss function values
Fig. 9. Convergence curve of the proposed network structure
Fig. 10. Results of different scenes. (a) Scene 1, effect of the test target board 1(13.826 lx); (b) Scene 2, effect of the test target board 2(13.826 lx); (c) Scene 3, effect of the test target board 3 (13.826 lx); (d) Scene 4, real underwater photoelectronic test results; (e) Scene 5, effect of the target board 1 (6.947 lx)
| ||||||||||||||||||
Table 1. Structure of the dataset
|
Table 2. Average time for the different methods
|
Table 3. [in Chinese]
|
Table 4. RMSC values of different methods

Set citation alerts for the article
Please enter your email address
© Copyright 2018-2021 | Chinese Laser Press. All Rights Reserved 沪ICP备15018463号-20