• Laser & Optoelectronics Progress
  • Vol. 55, Issue 12, 122201 (2018)
Xinchun Lu*, Yinghua Yuan, Yingqi Sun, Shudi Zhao, and Yonggang Luo
Author Affiliations
  • NARI Group Corporation/State Grid Electric Power Research Institute, Nanjing, Jiangsu 211000, China
  • show less
    DOI: 10.3788/LOP55.122201 Cite this Article Set citation alerts
    Xinchun Lu, Yinghua Yuan, Yingqi Sun, Shudi Zhao, Yonggang Luo. Development of Micro-Spectrophotometer and Its Application in Online Hexavalent Chromium Water Quality Monitoring Instrument[J]. Laser & Optoelectronics Progress, 2018, 55(12): 122201 Copy Citation Text show less
    Design diagram of spectrophotometer
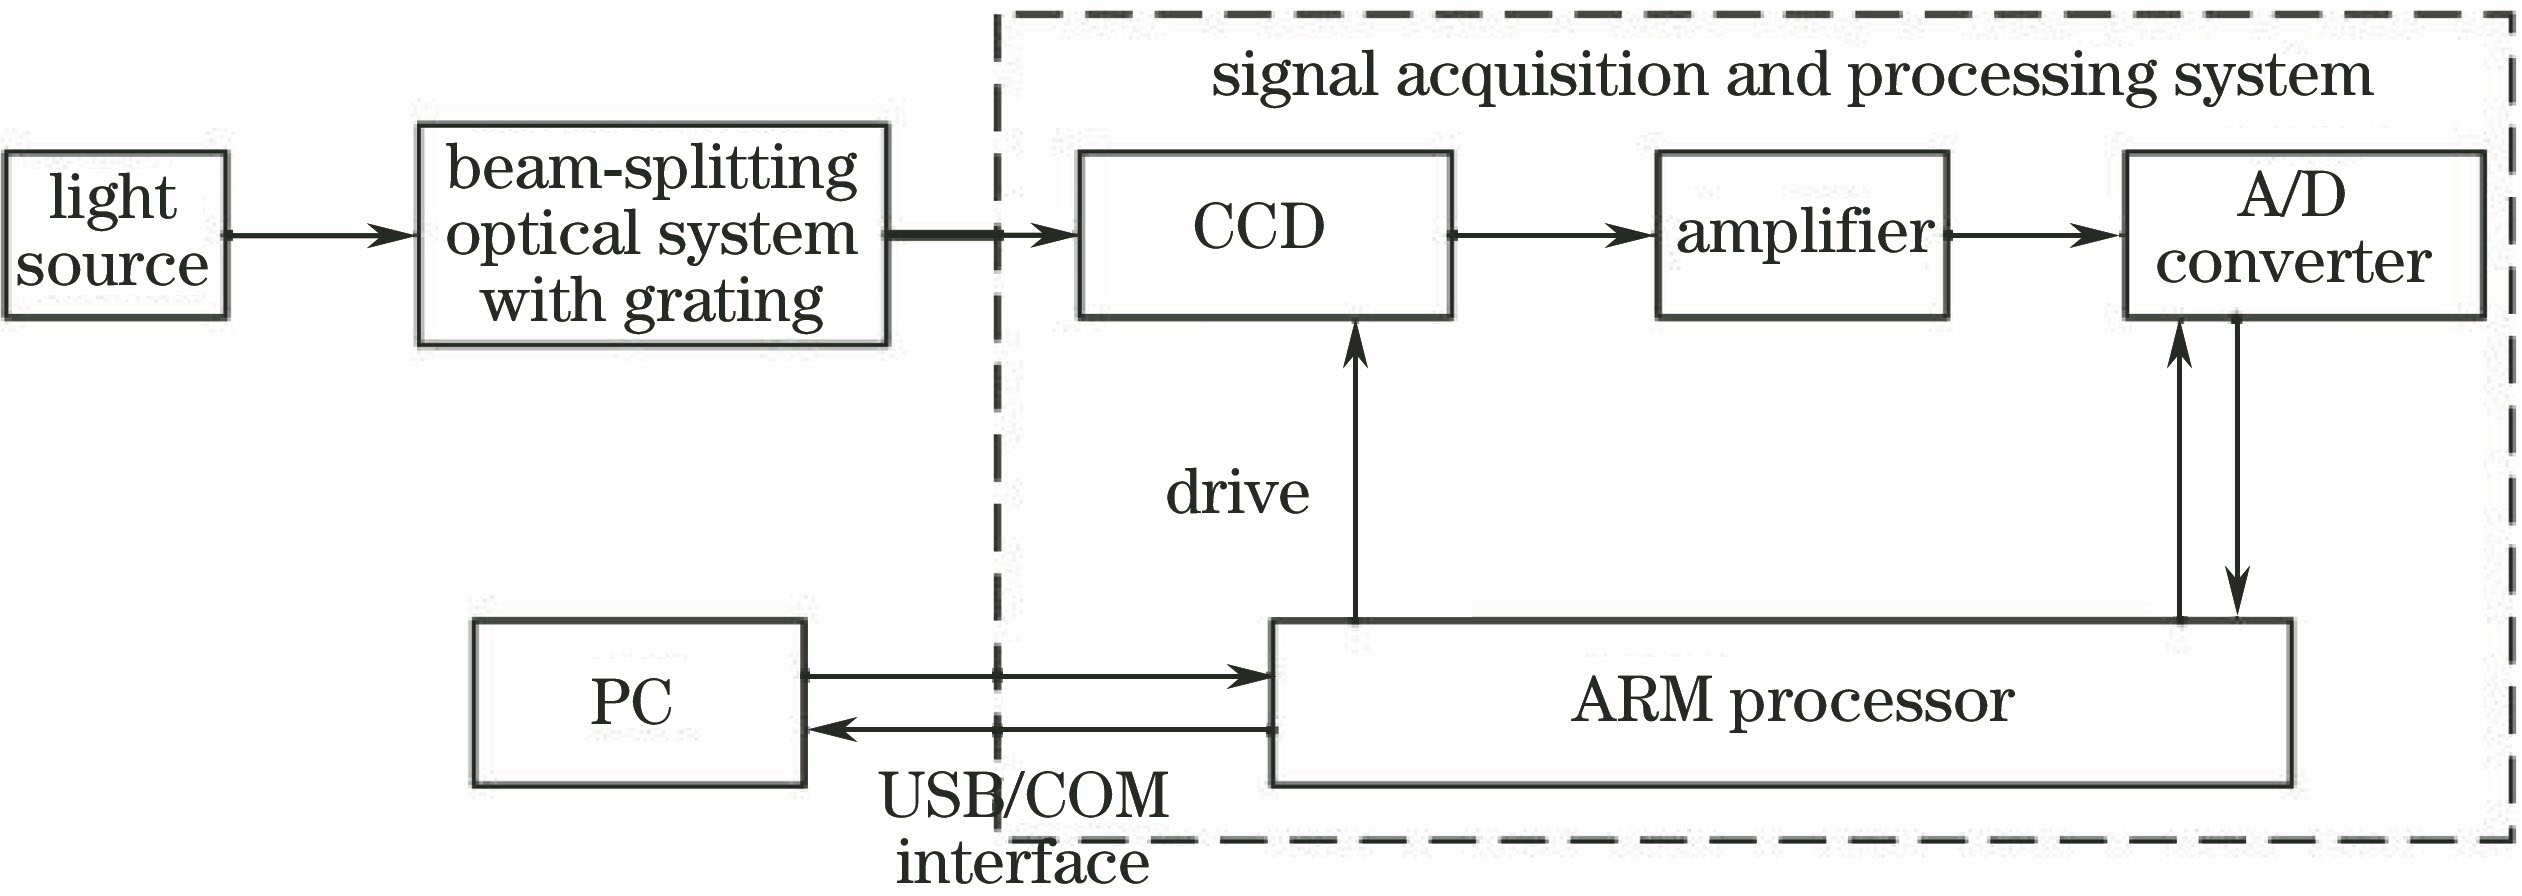
    Fig. 1. Design diagram of spectrophotometer
    Structural diagram of optical system of micro-spectrophotometer
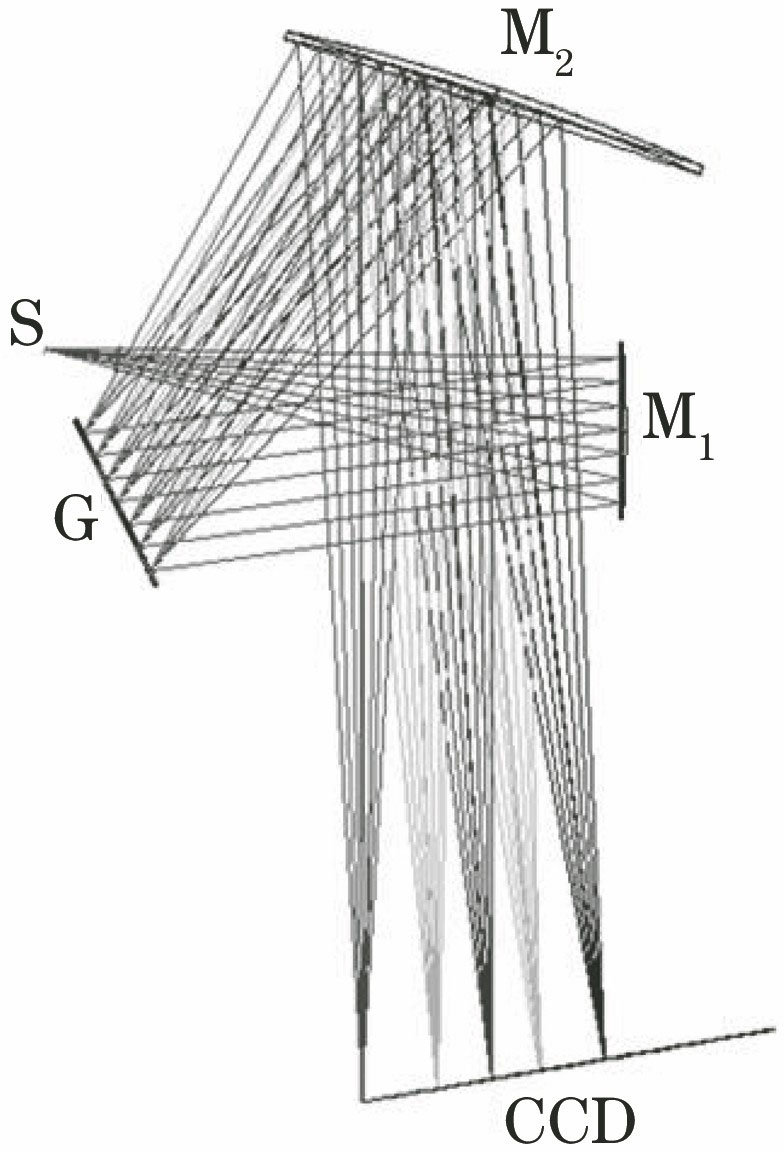
    Fig. 2. Structural diagram of optical system of micro-spectrophotometer
    Spot diagrams of system. (a) 200 nm; (b) 400 nm; (c) 550 nm; (d) 700 nm; (e) 900 nm
    Fig. 3. Spot diagrams of system. (a) 200 nm; (b) 400 nm; (c) 550 nm; (d) 700 nm; (e) 900 nm
    Schematic of circuit design for micro-spectrophotometer
    Fig. 4. Schematic of circuit design for micro-spectrophotometer
    Schematic of wavelength calibration experimental setup
    Fig. 5. Schematic of wavelength calibration experimental setup
    Spectrogram of calibration light source
    Fig. 6. Spectrogram of calibration light source
    Spectrum of resolution testing
    Fig. 7. Spectrum of resolution testing
    Schematic of online hexavalent chromium water quality monitoring system
    Fig. 8. Schematic of online hexavalent chromium water quality monitoring system
    Working curves of online hexavalent chromium water quality monitoring system. (a) Absorbance curves; (b) linear fitting curve
    Fig. 9. Working curves of online hexavalent chromium water quality monitoring system. (a) Absorbance curves; (b) linear fitting curve
    SurfacetypeRadius /mmThickness /mmTilt /(°)
    S40.0
    M180.035.08
    GInfinity37.518
    M2152.465.028
    Table 1. Structural parameters of beam splitting system
    Tolerance typeM1M1 to GGG to M2M2
    Index tolerance Δn2C2C2C
    Abbe tolerance ΔV2C2C2C
    Fringe tolerance N (546.1 nm)11
    Surface irregularity tolerance ΔN (546.1 nm)0.50.5
    Surface decenter tolerance /mm0.050.050.05
    Surface tilt tolerance /(')111
    Interval tolerance Δd /mm0.050.05
    Compensator of back focus /mm0.1
    Table 2. Tolerance distributions of spectrophotometer
    FittingcoefficientPixelnumberStandardwavelength /nmCalibrationwavelength /nmRelativeerror /nm
    -46.066926801253.652253.6650.013
    0.38423091111365.015365.0290.014
    -1.1850444×10-51312435.833435.739-0.094
    -8.4414396×10-101633546.074546.1050.031
    1731579.066579.1500.084
    2087696.543696.534-0.009
    2296763.511763.439-0.072
    2581852.144852.1770.033
    Table 3. Wavelength calibration data
    Xinchun Lu, Yinghua Yuan, Yingqi Sun, Shudi Zhao, Yonggang Luo. Development of Micro-Spectrophotometer and Its Application in Online Hexavalent Chromium Water Quality Monitoring Instrument[J]. Laser & Optoelectronics Progress, 2018, 55(12): 122201
    Download Citation