
Lijun Guo, Jianwei Zhang, Yanqiong Guo, Yanzhang Li, Kun Ren. Three-Dimensional Reconstruction Method Based on Speckle and Phase Hybrid Light Field Modulation[J]. Laser & Optoelectronics Progress, 2022, 59(10): 1015008
- Laser & Optoelectronics Progress
- Vol. 59, Issue 10, 1015008 (2022)
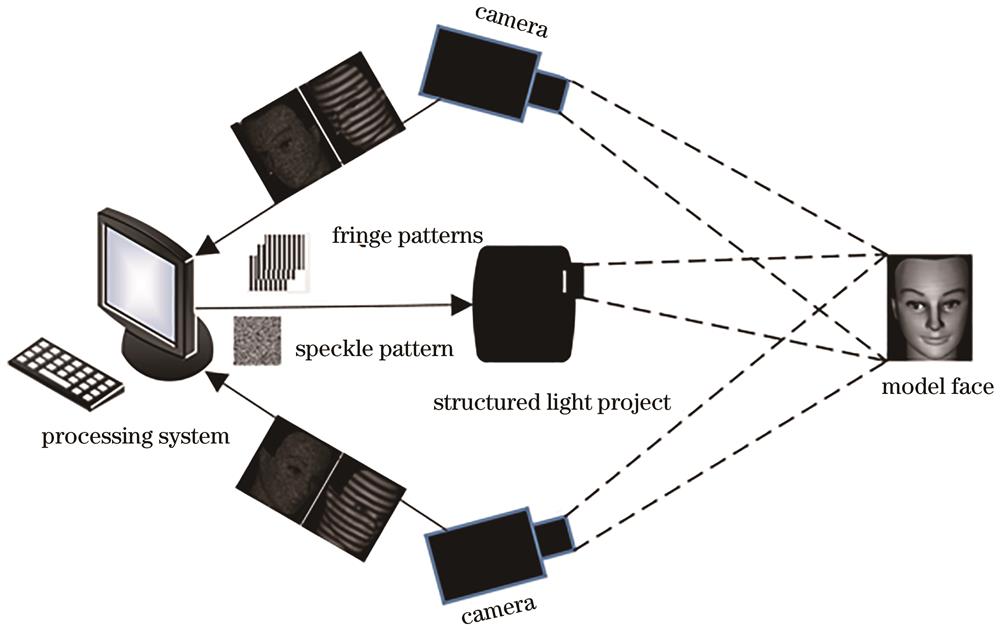
Fig. 1. Three-dimensional reconstruction platform based on speckle stripe structured light stereo matching
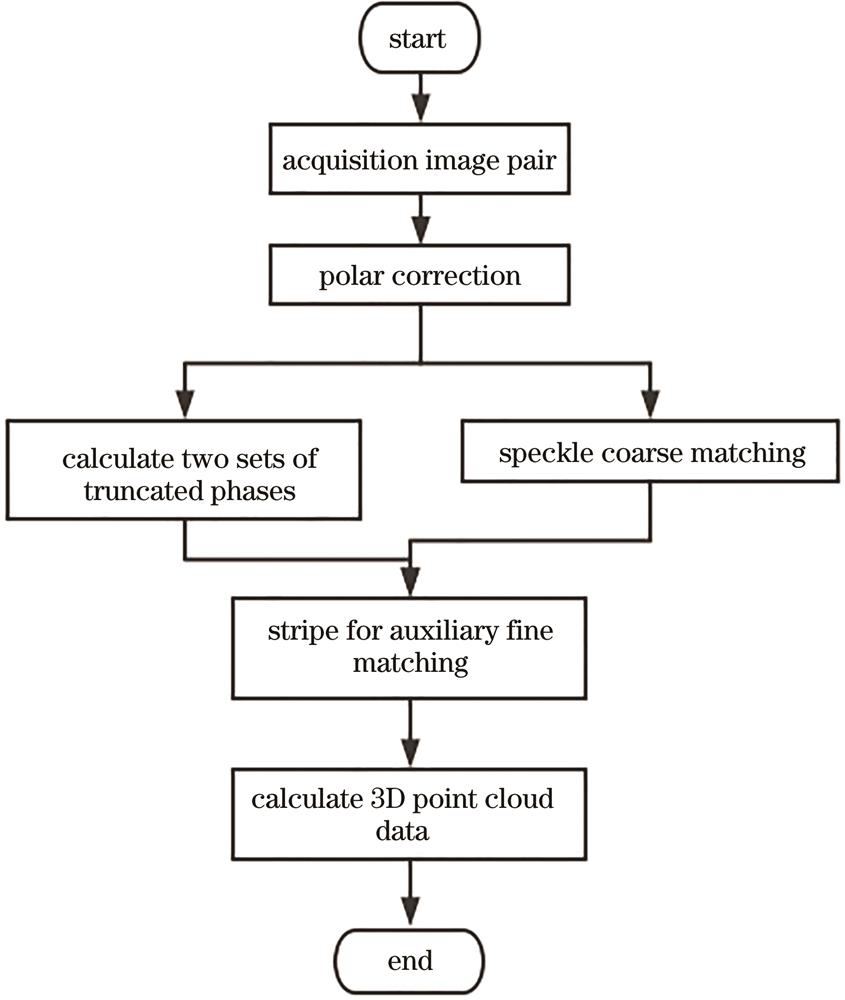
Fig. 2. Flow chart of three-dimensional reconstruction algorithm
Fig. 3. Digital speckle pattern
Fig. 4. Epipolar geometry in binocular stereo vision
Fig. 5. Principle of region-based stereo matching
Fig. 6. Standard sinusoidal grating fringe pattern
Fig. 7. Rough matching based on speckle
Fig. 8. Sub-pixel matching based on phase linear interpolation. (a) Matching point on the right side of Xr1; (b) matching point on the left side of Xr1
Fig. 9. Deformed grating stripes of the face to be tested. (a) Left camera; (b) right camera
Fig. 10. Processing of the truncated phase boundary. (a) Maximum point of wrapped phase map; (b) minimum point of wrapped phase map
Fig. 11. Modeling disparity map of the face of the model to be tested. (a) Coarse matching; (b) fine matching
Fig. 12. Experiment platform
Fig. 13. Modeling results of different methods. (a) Texture map of the face to be tested; (b) method I; (c) method II; (d) modeling results of texture sticking of our method; (e) modeling results of our method; (f) method III
| |||||||||||||||||||||||||||||
Table 1. Measurement results of distance of sphere centre
| |||||||||||||||||||||||||||||
Table 2. Measurement results of the diameter of right ball
|
Table 3. Face modeling errors of different methods
|
Table 4. Modeling time of four methods

Set citation alerts for the article
Please enter your email address
© Copyright 2018-2021 | Chinese Laser Press. All Rights Reserved 沪ICP备15018463号-20