
Xiao-yan ZHAO, Li-jun YANG, Yi-ming HUANG, Shi-cheng HUANG, Wang LI. Study on Arc Characteristic of Flux-Cored Wire Pulse TIG Arc Additive Manufacturing[J]. Spectroscopy and Spectral Analysis, 2021, 41(8): 2397
- Spectroscopy and Spectral Analysis
- Vol. 41, Issue 8, 2397 (2021)
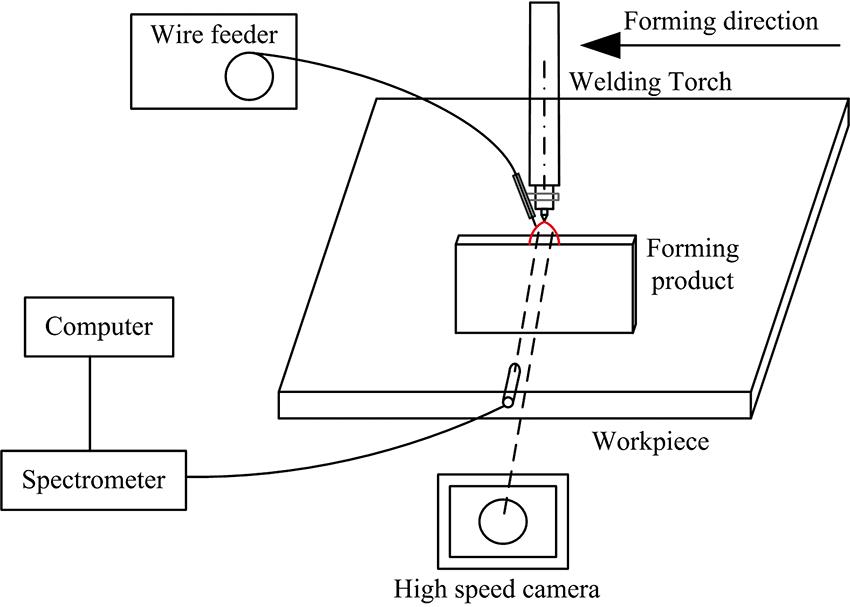
Fig. 1. Schematic diagram of experimental setup
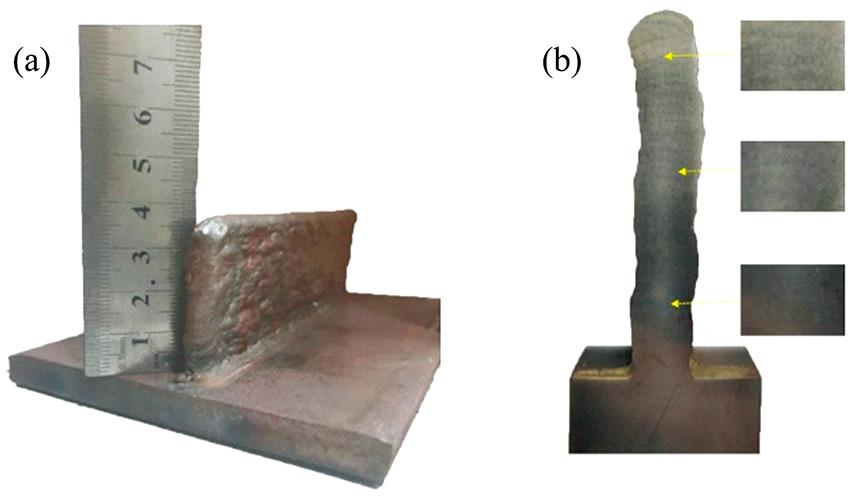
Fig. 2. Thin-walled part
(a): Appearance shape; (b): Shape of transversal section
(a): Appearance shape; (b): Shape of transversal section
Fig. 3. Schematic diagram of spectral scanning
Fig. 4. Transition pulsed arc and droplet transition along slag column
(a): 50/190 A; (b): 50/100 A
(a): 50/190 A; (b): 50/100 A
Fig. 5. Liquid bridge transition
(a): 50/190 A; (b): 50/100 A
(a): 50/190 A; (b): 50/100 A
Fig. 6. Spectrum about TIG arc additive manufacturing filled by fluxed-cored wire
Fig. 7. Distribution of arc temperature field under different pulse peak current
(a): 190 A; (b): 160 A; (c): 130 A; (d): 100 A
(a): 190 A; (b): 160 A; (c): 130 A; (d): 100 A
Fig. 8. Distribution of arc temperature field under pulse base current
Fig. 9. Characteristic elemental spectrum of flux-cored wire
Fig. 10. Distribution of active elements under different pulse peak current
(a): 190 A; (b): 160 A; (c): 130 A; (d): 100 A
(a): 190 A; (b): 160 A; (c): 130 A; (d): 100 A
Fig. 11. Distribution of active element under pulse base current
(a): 50 A (Pulse peak current is 190 A); (b): 50 A (Pulse peak current is 160 A);(c): 50 A (Pulse peak current is 130 A); (d): 50 A (Pulse peak current is 100 A)
(a): 50 A (Pulse peak current is 190 A); (b): 50 A (Pulse peak current is 160 A);(c): 50 A (Pulse peak current is 130 A); (d): 50 A (Pulse peak current is 100 A)
|
Table 1. Experimental parameters
|
Table 2. Spectroscopic constants of Argon ion transitions

Set citation alerts for the article
Please enter your email address
© Copyright 2018-2021 | Chinese Laser Press. All Rights Reserved 沪ICP备15018463号-20