• Photonics Research
  • Vol. 11, Issue 5, 878 (2023)
Emiliano Staffoli*, Mattia Mancinelli, Paolo Bettotti, and Lorenzo Pavesi
Author Affiliations
  • Nanoscience Laboratory, Department of Physics, University of Trento, 38123 Trento, Italy
  • show less
    DOI: 10.1364/PRJ.483356 Cite this Article Set citation alerts
    Emiliano Staffoli, Mattia Mancinelli, Paolo Bettotti, Lorenzo Pavesi. Equalization of a 10 Gbps IMDD signal by a small silicon photonics time delayed neural network[J]. Photonics Research, 2023, 11(5): 878 Copy Citation Text show less
    Experimental setup. The full link consists of a transmission stage, the optical fiber, the photonic neural network (PNN) device, and the receiver stage. Two fast photodetectors (RX1 and RX2) allow for measuring the input and the transmitted signals. The inset shows the actual design of the PNN device, where one can observe the cascaded 1×4 and 4×1 splitter and combiner, the three spirals, and the four phase shifters (small blue rectangles) connected to the external DC current controller. Details are given in Appendix A or in Ref. [17].
    Fig. 1. Experimental setup. The full link consists of a transmission stage, the optical fiber, the photonic neural network (PNN) device, and the receiver stage. Two fast photodetectors (RX1 and RX2) allow for measuring the input and the transmitted signals. The inset shows the actual design of the PNN device, where one can observe the cascaded 1×4 and 4×1 splitter and combiner, the three spirals, and the four phase shifters (small blue rectangles) connected to the external DC current controller. Details are given in Appendix A or in Ref. [17].
    Testing of the photonic neural network device on a 125 km fiber link. (a)–(c) Eye diagrams of (a) the input signal, (b) the transmitted signal without the PNN device in the link, and (c) the transmitted signal with the trained PNN device in the link. The dashed red lines refer to the sampling time that is used to generate the histograms. (d)–(f) Histograms of the power levels associated with the 2nd sample in the input bit sequence for (d) the input signal, (e) the transmitted signal without the PNN device in the link, and (f) the transmitted signal with the trained PNN device in the link. The red and green columns refer to the input 0s and 1s, respectively. The dashed vertical lines set the decision threshold. The sub-optimal choice of the threshold in (e) derives from discretization of the possible threshold values. (g) The actual temporal sequences for the transmitted signal as recorded by the RX2 (line with the PNN device in the link, dashed line without). The light black line refers to the digital input. Circles highlight the 2nd sample in each bit that is used in the BER calculations. Horizontal dashed lines show the different thresholds for the equalized and non-equalized data used to minimize the BER. Threshold values are rescaled according to the normalization used to plot the curves.
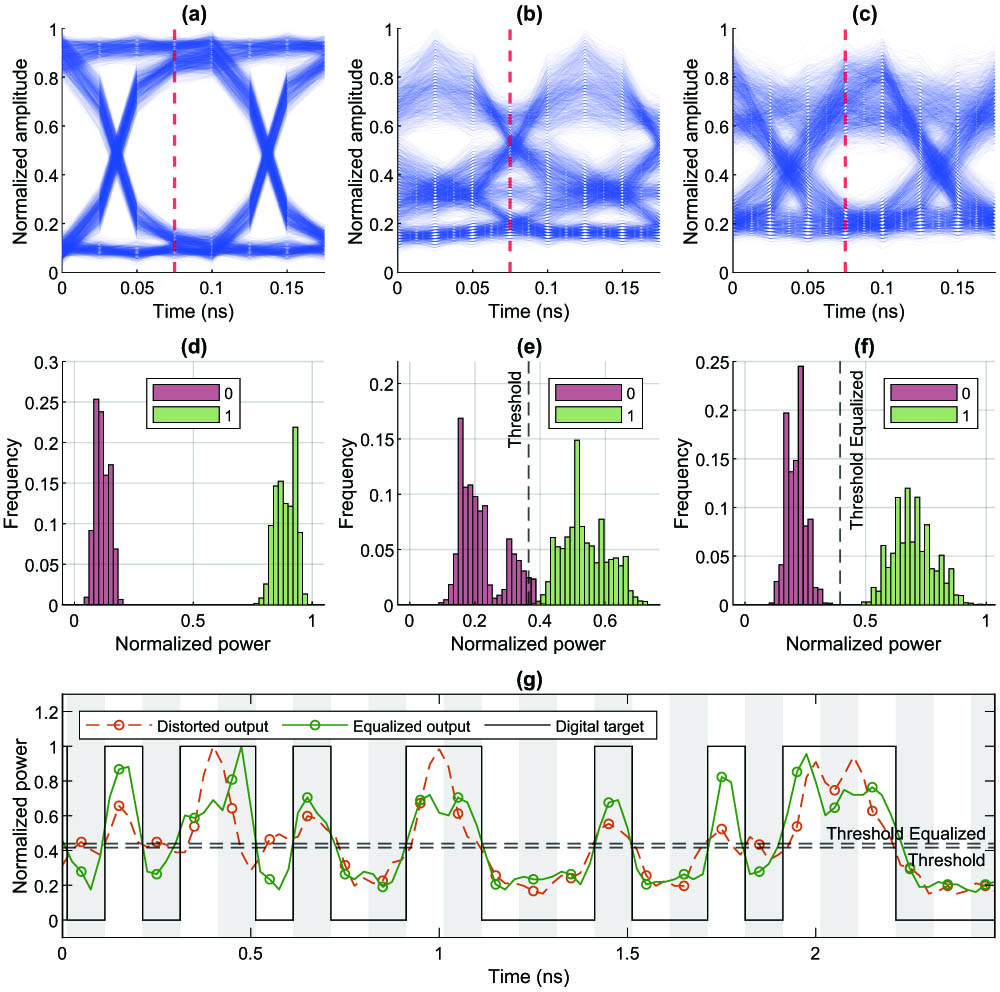
    Fig. 2. Testing of the photonic neural network device on a 125 km fiber link. (a)–(c) Eye diagrams of (a) the input signal, (b) the transmitted signal without the PNN device in the link, and (c) the transmitted signal with the trained PNN device in the link. The dashed red lines refer to the sampling time that is used to generate the histograms. (d)–(f) Histograms of the power levels associated with the 2nd sample in the input bit sequence for (d) the input signal, (e) the transmitted signal without the PNN device in the link, and (f) the transmitted signal with the trained PNN device in the link. The red and green columns refer to the input 0s and 1s, respectively. The dashed vertical lines set the decision threshold. The sub-optimal choice of the threshold in (e) derives from discretization of the possible threshold values. (g) The actual temporal sequences for the transmitted signal as recorded by the RX2 (line with the PNN device in the link, dashed line without). The light black line refers to the digital input. Circles highlight the 2nd sample in each bit that is used in the BER calculations. Horizontal dashed lines show the different thresholds for the equalized and non-equalized data used to minimize the BER. Threshold values are rescaled according to the normalization used to plot the curves.
    Training outcomes for signal equalization as a function of the fiber link length. (a) The optimized experimental currents and (b) the simulated optimized relative phase shifts in channels 2 (blue dots), 3 (green stars), and 4 (red triangles) after the training. Error bars in (a) (barely visible) derive from the instrument output precision, not from statistics. The phase shifts in (b) are measured in each channel with respect to the 1st channel (no spiral). PSO is chosen as the training algorithm in both cases.
    Fig. 3. Training outcomes for signal equalization as a function of the fiber link length. (a) The optimized experimental currents and (b) the simulated optimized relative phase shifts in channels 2 (blue dots), 3 (green stars), and 4 (red triangles) after the training. Error bars in (a) (barely visible) derive from the instrument output precision, not from statistics. The phase shifts in (b) are measured in each channel with respect to the 1st channel (no spiral). PSO is chosen as the training algorithm in both cases.
    (a)–(c) Experimental (full lines) and simulated (dashed lines) BER versus the PRX curves: the black discs refer to the back-to-back (BTB) configuration (the transmission stage is directly interfaced to the receiver), the red stars to the transmission by a fiber link, and the blue triangles to the transmission by a fiber link with the PNN device. Dashed horizontal black lines refer to the pre-FEC threshold value. The error bars are calculated as the standard deviation over multiple acquisitions (see Appendix A). The error-free points are replaced by 1×10⁻⁷ due to the finite dimension of the data set. The used fiber link is (a) 75 km long, (b) 100 km long, or (c) 125 km long. (d) The overall gain provided by the PNN device as a function of the fiber link length (blue discs experiment, orange triangles simulation). The gain is given as the improvement of the PRX at a BER=2×10⁻³ when the PNN device is used with respect to the results without the PNN device. The dashed line marks the threshold above which the gain, guaranteed by the equalization, is greater than the PNN device excess loss of about 8.5 dB.
    Fig. 4. (a)–(c) Experimental (full lines) and simulated (dashed lines) BER versus the PRX curves: the black discs refer to the back-to-back (BTB) configuration (the transmission stage is directly interfaced to the receiver), the red stars to the transmission by a fiber link, and the blue triangles to the transmission by a fiber link with the PNN device. Dashed horizontal black lines refer to the pre-FEC threshold value. The error bars are calculated as the standard deviation over multiple acquisitions (see Appendix A). The error-free points are replaced by 1×10⁷ due to the finite dimension of the data set. The used fiber link is (a) 75 km long, (b) 100 km long, or (c) 125 km long. (d) The overall gain provided by the PNN device as a function of the fiber link length (blue discs experiment, orange triangles simulation). The gain is given as the improvement of the PRX at a BER=2×10³ when the PNN device is used with respect to the results without the PNN device. The dashed line marks the threshold above which the gain, guaranteed by the equalization, is greater than the PNN device excess loss of about 8.5 dB.
    (a) BER versus the link length with a SNR=12 dB at the receiver for the link without the PNN device (dashed blue line and triangles), with the PNN device and a delay granularity of 12.5 ps (full purple line and stars), and with the PNN device and a delay granularity of 18.75 ps (full orange line and circles). (b) The SNR penalty at a BER of 2.26×10⁻⁴ as a function of the link length without the PNN device (dashed blue line and triangles), with the PNN device and a delay granularity of 12.5 ps (full purple line and stars), and with the PNN device and a delay granularity of 18.75 ps (full orange line and circles). The penalty is calculated from the back-to-back performance. Curves are interrupted at the last fiber length value for which it was possible to interpolate the chosen BER threshold in the corresponding BER versus the PRX profile.
    Fig. 5. (a) BER versus the link length with a SNR=12  dB at the receiver for the link without the PNN device (dashed blue line and triangles), with the PNN device and a delay granularity of 12.5 ps (full purple line and stars), and with the PNN device and a delay granularity of 18.75 ps (full orange line and circles). (b) The SNR penalty at a BER of 2.26×10⁴ as a function of the link length without the PNN device (dashed blue line and triangles), with the PNN device and a delay granularity of 12.5 ps (full purple line and stars), and with the PNN device and a delay granularity of 18.75 ps (full orange line and circles). The penalty is calculated from the back-to-back performance. Curves are interrupted at the last fiber length value for which it was possible to interpolate the chosen BER threshold in the corresponding BER versus the PRX profile.
    Experimental setup. The different symbols are self-explanatory and are discussed in the text. The inset shows the design of the PNN device.
    Fig. 6. Experimental setup. The different symbols are self-explanatory and are discussed in the text. The inset shows the design of the PNN device.
    Emiliano Staffoli, Mattia Mancinelli, Paolo Bettotti, Lorenzo Pavesi. Equalization of a 10 Gbps IMDD signal by a small silicon photonics time delayed neural network[J]. Photonics Research, 2023, 11(5): 878
    Download Citation