
Zijian Cui, Yue Wang, Yongqiang Shi, Yongqiang Zhu, Dachi Zhang, Zhiqi Hong, Xuping Feng, "Significant sensing performance of an all-silicon terahertz metasurface chip for Bacillus thuringiensis Cry1Ac protein," Photonics Res. 10, 740 (2022)
- Photonics Research
- Vol. 10, Issue 3, 740 (2022)
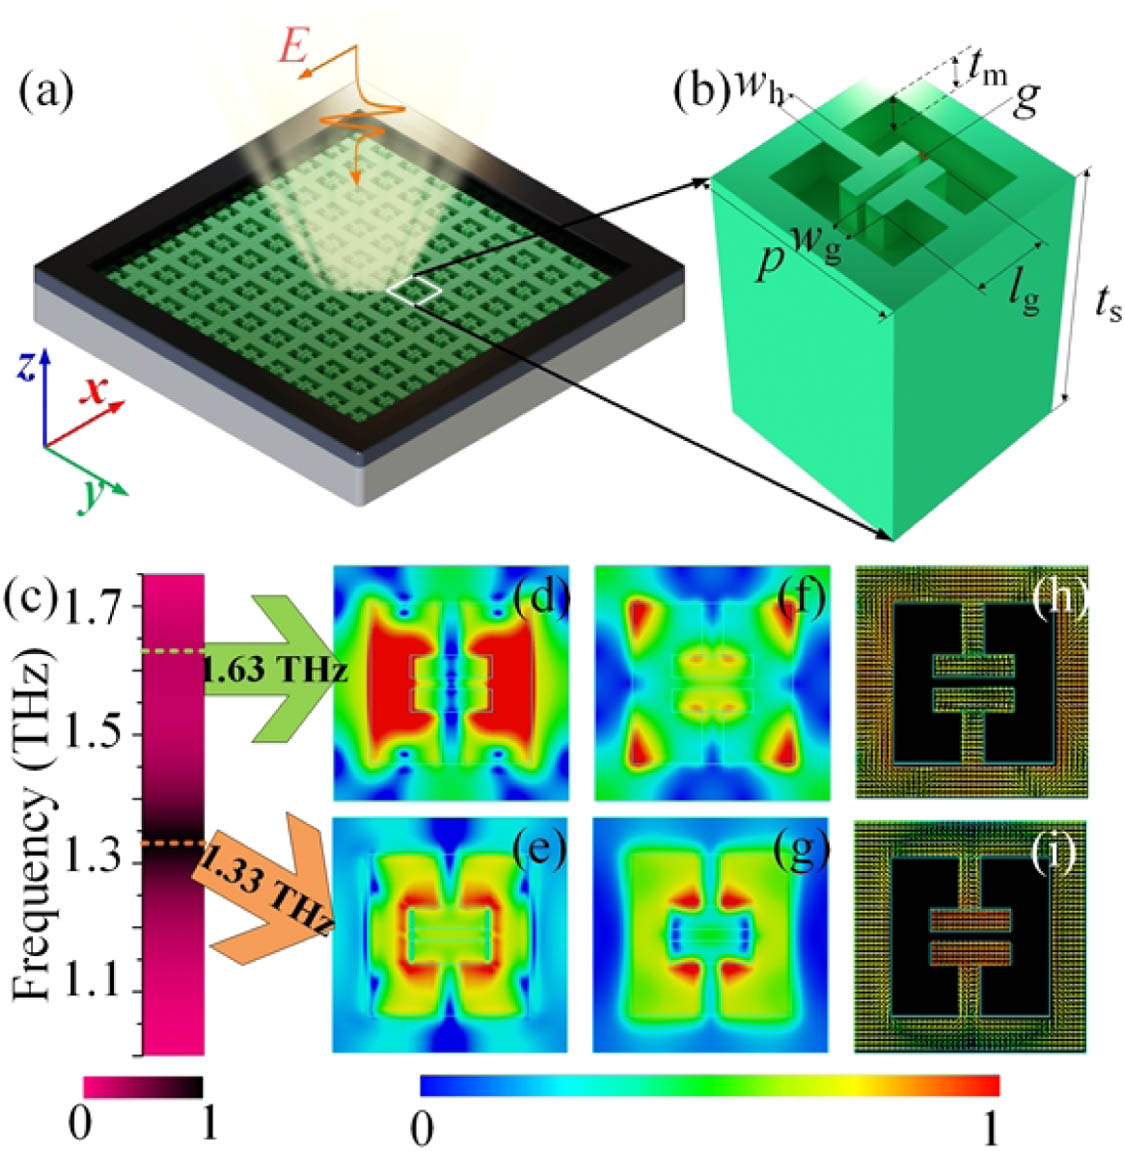
Fig. 1. (a) Schematic of the designed APM. (b) Illustration of the unit cell. (c) Normalized absorbance spectrum obtained from simulation. (d), (e) Electric and (f), (g) magnetic field distributions, and (h), (i) current density for 1.63 THz and 1.33 THz, respectively.
Fig. 2. (a) Picture of APM. (b) Microphotograph of the APM. Inset: scanning electron microscope (SEM) image of the cross section. (c) Absorbance spectra of the designed APM obtained from the experiment, simulation, and effective media theory. (d) Effective refraction index of the resonance layer (RL), and (e) of the silicon substrate (substrate layer, SL) expressed by the Drude model.
Fig. 3. Measurements of absorbance spectra of Bt protein deposited on the metasurface, with solution concentrations of 5 ppm, 10 ppm, 20 ppm, 50 ppm, 80 ppm, 100 ppm, 150 ppm, 200 ppm, 250 ppm, 300 ppm, 350 ppm, 400 ppm, 450 ppm, and 500 ppm. (b) Schematic diagram of APM detection of Bt protein. Regression results between protein solution concentrations and (c) peak intensity and (d) peak frequency. (e) Frequency shift and amplitude change in other references.
Fig. 4. (a) Simulation results of absorbance spectra of analyte attached on the metasurface with thickness from 1 to 15 μm. (b) Schematic diagram of detection simulation. Regression results between analyte thickness and (c) peak intensity and (d) peak frequency.
Fig. 5. Simulated absorbance spectra of metasurface attaching varying thickness analyte when (a) f = 0.01 f = 0.1 f = 0.3 f = 0.5 f = 1
Fig. 6. (a)–(h) Simulated absorbance spectra of metasurface attaching varying thickness analyte when ε
Fig. 7. Stability properties of APM under different factors. (a) Absorbance spectra over continuous testing and (b) stability of peak intensity within 150 min; (c), (d) stability tested under different humidities; and (e), (f) stability tested under different temperatures.


Set citation alerts for the article
Please enter your email address

© Copyright 2018-2021 | Chinese Laser Press. All Rights Reserved 沪ICP备15018463号-20