
Zijian Cui, Yue Wang, Yongqiang Shi, Yongqiang Zhu, Dachi Zhang, Zhiqi Hong, Xuping Feng, "Significant sensing performance of an all-silicon terahertz metasurface chip for Bacillus thuringiensis Cry1Ac protein," Photonics Res. 10, 740 (2022)
- Photonics Research
- Vol. 10, Issue 3, 740 (2022)
Abstract
1. INTRODUCTION
To increase production effectivity and enhance the adversity resistance of plants, genetic modification technology has been recommended to meet the demand of the ever-growing human population, among which the insertion of an insect-resistant gene is the most important genetically modified (GM) crop [1]. The insertion of a foreign gene expressing the Bacillus thuringiensis (Bt) Cry1Ac toxin is widely used in crop production because of its high effectiveness on crop-destroying insects. However, planting GM crops is still controversial because of biosafety [2]. Despite the economic, health, and environmental benefits in some cases, many countries impose mandatory labeling and strict monitoring on foods harvested from GM crops because of concerns over the lack of safety of crops and delayed or unforeseen effects on human health or the environment [3]. However, it is inevitable to prevent GM crops without authorization from illegally flowing into the market, and therefore it is necessary to detect the agricultural products in circulation on the market. At present, two primary approaches have been developed to carry out GM crop detection: the first is to detect inserted foreign genes, typically, through polymerase chain reaction; the second is to detect proteins specifically expressed in GM crops. Those methods have been successfully implemented into a series of actual testing needs; however, higher expenses and dependence on sophisticated equipment and skilled personnel are inevitable. For this reason, there is a need to develop an efficient, fast, and low-cost technology for Bt protein detection.
Low photon energy properties and nonionizing characteristics enable a terahertz (THz) wave to detect biochemical molecules without critical damage or ionization side effects. In particular, the enhancement of trace amount biochemical molecules and THz wave interaction mediated by metasurfaces has been highly anticipated. The metasurface is an artificial periodic array of an exquisitely designed unit resonator [4–6]. Inductor (L) and capacitor (C), dipole, multipole resonance caused by the resonator, and the surface plasmon polariton mode excited by periodic arrays lead to huge electromagnetic field (EM) enhancement at the interface. Therefore, the metasurface array is extremely sensitive to variations of the surrounding dielectric environment, for instance, when analyte covers it. The effect of the analyte will be reflected in the spectral variation of the metasurfaces, such as resonance frequency change and amplitude variation, which enable the metasurface to identify small spectral perturbations and thus work as a sensor [7–9]. It has been reported that a metasurface has been used as a sensor in biochemical detection fields, such as carbendazim, sugar, cancer cell, and pesticide residue detection using a metal array structure, as well as sensing of deep subwavelength thickness film [10–13]. However, the sensing of the Bt protein using an all-silicon metasurface has not been reported. The limitations described above for Bt protein sensing and the feasibility of the metasurface sensor led us to propose an alternative for Bt protein detection.
In this paper, we propose an all-silicon plasma metasurface (APM) for high sensitivity Bt protein sensing applications. Specifically, we implement both surface plasmon polariton resonance and dipole resonance on the structured silicon surface, which provides extremely strong localized EM confinement surrounding the unit cell structure. This enhanced field delivers variation of the surrounding analyte to the spectra. The unit cell of the designed metasurface is similar to the complementary metasurface based on metal material [14], and the patterns of the periodic arrays are etched downward on the silicon surface by deep reactive-ion etching. By performing regression analyses on spectra of the treated metasurface, the relations among spectral frequency shifts, absorbance variations, and various Bt protein concentrations can be obtained. In addition, the distribution of Bt protein residues on metasurface samples was estimated by analyzing the effects of different regions near the metasurface on the spectral changes, which has strong implications for confirming the location of protein residue in the actual process. Last, we show the reliability and stability of the metasurface chip by time period, temperature, and humidity control. These results prove that this APM can be used as a fast and accurate sensing tool for the determination of trace Bt protein, which provides feasibility for various applications in biological science.
Sign up for Photonics Research TOC. Get the latest issue of Photonics Research delivered right to you!Sign up now
2. DESIGN AND STRUCTURE
Figure 1(a) shows the schematic of the fabricated APM. The periodical repetition of unit cells constitutes devices with a structural area (
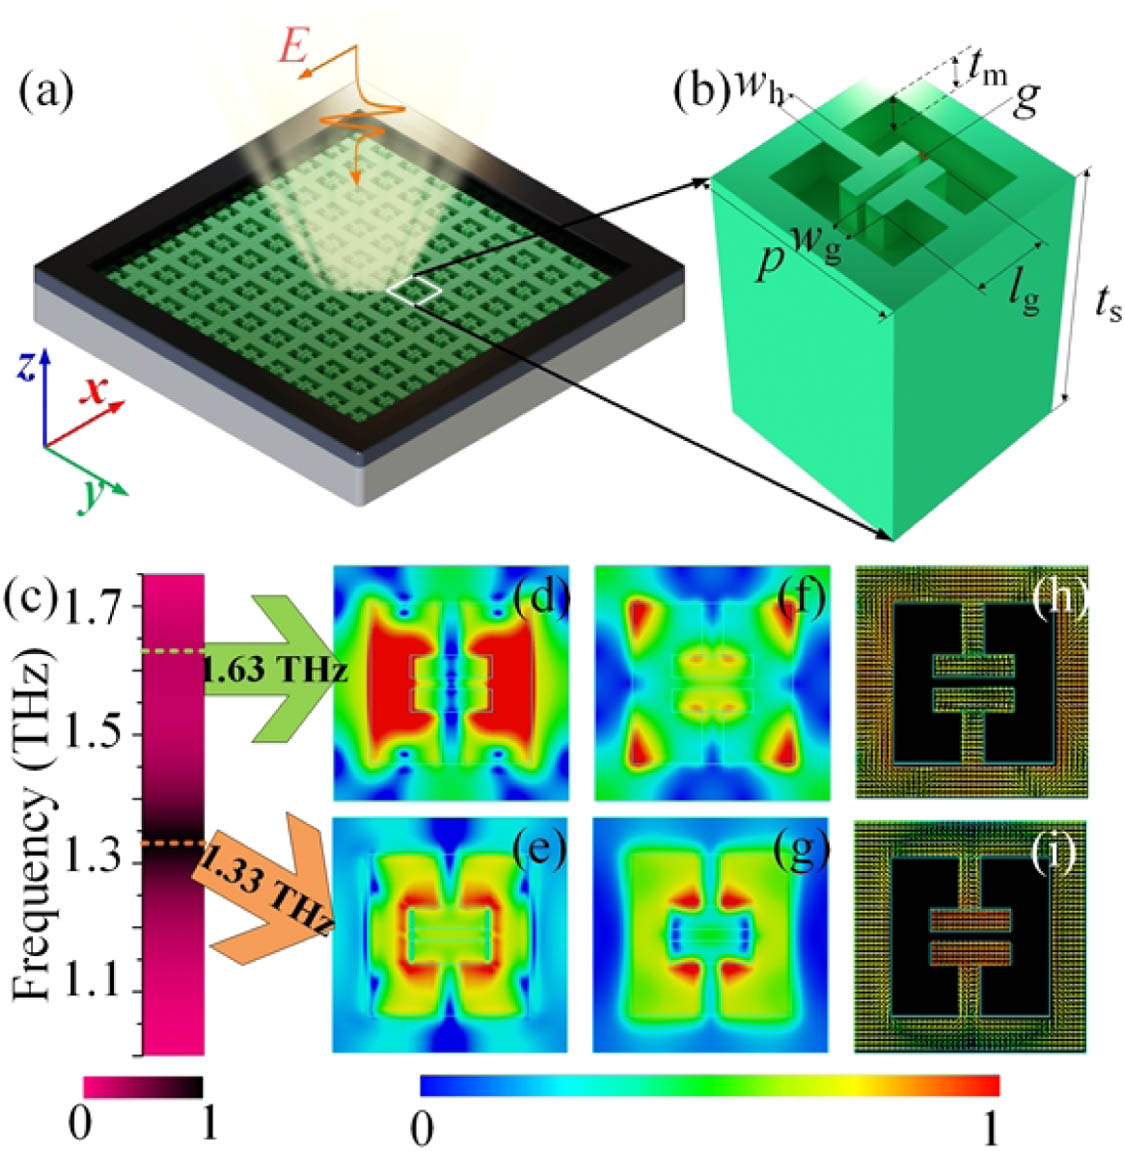
Figure 1.(a) Schematic of the designed APM. (b) Illustration of the unit cell. (c) Normalized absorbance spectrum obtained from simulation. (d), (e) Electric and (f), (g) magnetic field distributions, and (h), (i) current density for 1.63 THz and 1.33 THz, respectively.
3. RESULTS AND DISCUSSION
A. Simulation Analysis of APM
To determine the resonance characteristics of the APM, a series of simulations based on finite difference time-domain (FDTD) techniques was carried out. The intense resonance is shown in Fig. 1(c). The simulated absorbance spectrum shows that the designed structure has characteristic resonances at 1–1.75 THz frequency range, a strong absorbance peak at 1.33 THz, and a relatively weak peak at 1.63 THz. Moreover, we verified the electric and magnetic field distributions, and current density at the resonance frequency. For resonance at 1.33 THz, it is clear to see that the electric field is concentrated near the top of the opposing T-shaped pillar from the electric field distribution shown in Fig. 1(e). The magnetic field is mainly distributed in the direction orthogonal to the incident electric field, as shown in Fig. 1(g). These field distribution patterns reveal that this resonance is mainly caused by localized responses in the cavity outside the T-shaped pillar, which means the structural periodic array can be treated as a waveguide array [15]. The incident THz waves were diffracted by the periodic metasurface array, and surface plasmon polaritons were supported by the bound mode surrounding the T-shaped pillar when diffraction satisfied phase matching [16,17]. In addition, as shown in Fig. 1(i), the direction of the oscillating currents on top of the T-shaped pillar is constantly changing (along the top of the T-shaped pillar), which means that the device is extremely sensitive to the dielectric environment variation at the location. We also analyzed the distributions of the electric and magnetic fields, and current density at 1.63 THz, as shown in Figs. 1(d), 1(f), and 1(h). The electric field is chiefly focused in the cavity on either side of the T-shaped column, and the enhanced area becomes relatively larger, which means the reduction of field confinement ability. For the magnetic field, the field is mainly focused at four corners of the cavity. Despite being relatively weak, the profile of resonance mode at 1.33 THz can be distinguished from the magnetic field distribution at 1.63 THz, as shown in Fig. 1(f). As might be expected, this demonstrates the existence of coupling between two resonance modes. The coupling of these two resonance modes results in the absorption characteristics shown in Fig. 1(c).
B. Measurements of APM
To experimentally demonstrate the properties of the APM, we utilized conventional microfabrication techniques involving photolithography and deep reactive ion etching to fabricate it, and the resistivity of the doped silicon is
![]()
Figure 2.(a) Picture of APM. (b) Microphotograph of the APM. Inset: scanning electron microscope (SEM) image of the cross section. (c) Absorbance spectra of the designed APM obtained from the experiment, simulation, and effective media theory. (d) Effective refraction index of the resonance layer (RL), and (e) of the silicon substrate (substrate layer, SL) expressed by the Drude model.
A THz time-domain spectrometer (TDS) in reflected mode was applied to measure the absorbance spectrum because the highly doped silicon almost completely isolated the transmission signals. The experimental spectra shown in Fig. 2(c) exhibit a distinct peak at 1.33 THz and a relatively flat peak attached to it at about 1.63 THz, which is consistent with the simulated results.
C. Equivalent of APM
The localized electro-magnitude confinement surrounding the resonator units means that the geometric features of the APM play a major role in resonance, which determines the resonance intensity and frequency. Therefore, we divide the designed metasurface into a resonant layer (RL) and a substrate layer (SL) and calculate the absorbance spectrum quantitatively using the transfer matrix method (TMM) [18–20]. The equivalent permittivity of RL can be obtained by fitting, and of SL can be expressed by the Drude model. The calculated spectrum is shown in Fig. 2(c) and marked with a square. The effective refraction indices of the RL and SL are shown in Figs. 2(d) and 2(e). Details can be found in Appendix A. The equivalent strategy of the RL layer actually reflects the property of APM. The RL layer is similar to the anti-reflective layer coated on the silicon substrate. The incident THz wave undergoes complex reflection processes in the RL, which has a practical effect on the resonance, resulting in resonance absorption.
D. Bt Protein Sensing
We experimentally demonstrated that the proposed THz metasurface can act as an extremely sensitive and stable sensor for Bt protein sensing. The schematic diagram of the detection for the variable concentrations of Bt protein solution is shown in Fig. 3(b). In experimental measurement, Bt protein solutions (at concentrations of 5 ppm, 10 ppm, 20 ppm, 50 ppm, 80 ppm, 100 ppm, 150 ppm, 200 ppm, 250 ppm, 300 ppm, 350 ppm, 400 ppm, 450 ppm, and 500 ppm; ppm, parts per million) were dripped on the surface of the APM, and then the devices were placed in a dehumidified nitrogen environment to avoid the influence of water vapor. The residual protein crystals remained in the gap and therefore disturbed the dielectric environment on the surface, which led to absorption spectral changes.
![]()
Figure 3.Measurements of absorbance spectra of Bt protein deposited on the metasurface, with solution concentrations of 5 ppm, 10 ppm, 20 ppm, 50 ppm, 80 ppm, 100 ppm, 150 ppm, 200 ppm, 250 ppm, 300 ppm, 350 ppm, 400 ppm, 450 ppm, and 500 ppm. (b) Schematic diagram of APM detection of Bt protein. Regression results between protein solution concentrations and (c) peak intensity and (d) peak frequency. (e) Frequency shift and amplitude change in other references.
As shown in Fig. 3(a), there is a variation in both peak absorbance intensity and central peak frequency, which shows the particular trend. The boxed inset gives a zoomed view of the spectra. For the sake of intuition, analyses of regression were carried out. Regression analysis of the absorbance intensity and resonant frequency of the resonance peak results in the curves plotted in Figs. 3(c) and 3(d). The absorbance intensity tended to increase with increasing Bt protein concentration, and peak frequency shows a redshift trend. These results show that both the absorbance peak and central frequency of resonance had good linear correlations with Bt protein concentrations ranging from 5 to 500 ppm. Additionally, the absorbance intensity shift of the treated APM, from 5 to 500 ppm, was 0.405 (a.u.), accounting for 14% of the bare APM (
E. Analysis of Analytic Layer
To further analyze the mechanism of Bt protein-sensitive detection by implementation of the designed metasurface, a series of equivalent simulations was carried out. In the simulations, the different thicknesses of dielectric analyte layers were applied, equivalent to the residue of different concentrations of Bt protein solutions after drying. Considering that the metasurface samples are placed in parallel when treated with the protein solution, the Bt protein residuals tend to attach on the parallel surface of the metasurface (on the upper and lower surfaces of the metasurface) according to a certain thickness ratio
![]()
Figure 4.(a) Simulation results of absorbance spectra of analyte attached on the metasurface with thickness from 1 to 15 μm. (b) Schematic diagram of detection simulation. Regression results between analyte thickness and (c) peak intensity and (d) peak frequency.
In view of the fact that the electric field is distributed on both upper and lower surfaces, we realized that the thickness ratio between upper and lower surfaces will affect the absorbance. Therefore, the analysis was carried out with
![]()
Figure 5.Simulated absorbance spectra of metasurface attaching varying thickness analyte when (a)
As an important characteristic representing the dielectric environment surrounding the metasurface, the dielectric properties of the analyte layer are also worth further study. Therefore, simulations of the designed metasurface covered with an analyte layer of different permittivities were carried out. The absorbance spectra with the analyte of different permittivities are shown in Figs. 6(a)–6(h). The white arrows indicate the direction of frequency change, and it is clear that the white arrow has a clockwise rotation when
![]()
Figure 6.(a)–(h) Simulated absorbance spectra of metasurface attaching varying thickness analyte when
F. Stability of APM
Additional reliability experiments of temperature, humidity, and time period were tested to determine the stability of the designed metasurface, and corresponding results are shown in Fig. 7. A Bt protein solution of 5 ppm concentration was dropped on the surface of the APM, and the averaged value of the spectra was obtained through five repeated scans. As shown in Figs. 7(a) and 7(b), the spectra and peak intensity were measured every 10 min in a continuous process for 150 min. The absorbance spectra showed the stability of the time period. The peak intensity was basically concentrated on the average value of 2.95. Figures 7(c) and 7(d) show the measured spectra at various humidities. At a temperature of 24°C, we tested the spectrum and peak intensity when the humidity was controlled at 46%, 48%, 50%, 53%, 55%, 60%, 62%, 65%, 67%, 70%, and 75%. The maximum drift of the averaged value was 0.08, which shows the satisfactory stability of the devices. Figures 7(e) and 7(f) show the spectra and peak intensity measured at 10 different temperatures (21.5°C, 22°C, 22.5°C, 23°C, 24°C, 24.5°C, 25°C, 25.5°C, 26.5°C, and 27°C) at a humidity of 40%. The variation is less than 0.08. This indicates that the device can maintain good reliability when temperature is in the room temperature range. The temperature rise makes a minimal impact on peak intensity, as shown in Fig. 7(f). This insignificant increase in peak intensity (less than 0.09) is due to the enhancement of the thermal motion of molecules caused by rising temperature, which results in a slight increase in absorbance intensity. The error fluctuation in multiple continuous measurements was mainly caused by the internal instability of the THz-TDS system; however, the result was stable and reliable when we measured repeatedly and carried out averaging. A series of experimental results has proved that this APM sensor has good stability for the time period, humidity, and temperature.
![]()
Figure 7.Stability properties of APM under different factors. (a) Absorbance spectra over continuous testing and (b) stability of peak intensity within 150 min; (c), (d) stability tested under different humidities; and (e), (f) stability tested under different temperatures.
4. CONCLUSION
In conclusion, we experimentally demonstrate that an all-silicon THz metasurface based on structurally doped silicon can be used as a platform for Bt protein sensing. Both intensity and resonance frequency of absorbance spectra satisfy the linear relation with the solution concentration, which allows us to measure accurately concentrations of Bt protein solutions. The same spectral trend was obtained in the simulation and revealed that this linear relation can be attributed to the uneven protein residue attached to the APM. The impact of our work lies in providing a path for innovative designs and realization not only for a biosensor based on APM but also a research idea for analysis of the attached residue.
APPENDIX A
Simulations were carried out based on the finite integration technique. The perfect electric condition (PEC) boundary is selected in the
The propagation of the THz wave is equivalent to passing through stacked layers (air–RL–SL–air; 1/2/3/4). The reflection and transmission coefficients for normal incidence can be expressed by the following equations:
The refractive index of SL was obtained by the Drude model as expressed above, and the effective refractive index of RL was obtained by theory fitting.
The reflection and Cry1Ac protein standard in solid-state powder (analytical
References
[1] M. Gomez-Barbero, J. Berbel, E. Rodriguez-Cerezo. Bt corn in Spain - the performance of the EU’s first GM crop. Nat. Biotechnol., 26, 384-386(2008).
[2] B. R. Lu. Challenges of transgenic crop commercialization in China. Nat. Plants, 2, 16077(2016).
[3] M. Kamle, P. Kumar, J. K. Patra, V. K. Bajpai. Current perspectives on genetically modified crops and detection methods. 3 Biotech, 7, 219(2017).
[4] J. Y. Guo, T. Wang, H. Zhao, X. K. Wang, S. F. Feng, P. Han, W. F. Sun, J. S. Ye, G. H. Situ, H. T. Chen, Y. Zhang. Reconfigurable terahertz metasurface pure phase holograms. Adv. Opt. Mater., 7, 1801696(2019).
[5] Z. Yue, C. Zheng, J. Li, J. Liu, G. Wang, M. Chen, H. Xu, Q. Tan, H. Zhang. A dual band spin-selective transmission metasurface and its wavefront manipulation. Nanoscale, 13, 10898-10905(2021).
[6] X. L. You, R. T. Ako, W. S. L. Lee, M. Bhaskaran, S. Sriram, C. Fumeaux, W. Withayachumnankul. Terahertz transmissive half-wave metasurface with enhanced bandwidth. Opt. Lett., 46, 4164-4167(2021).
[7] J. Zhang, N. Mu, L. H. Liu, J. H. Xie, H. Feng, J. Q. Yao, T. N. Chen, W. R. Zhu. Highly sensitive detection of malignant glioma cells using metamaterial-inspired THz biosensor based on electromagnetically induced transparency. Biosens. Bioelectron., 185, 113241(2021).
[8] Z. Y. Zhang, C. Z. Zhong, F. Fan, G. H. Liu, S. J. Chang. Terahertz polarization and chirality sensing for amino acid solution based on chiral metasurface sensor. Sens. Actuators B Chem., 330, 129315(2021).
[9] H. Jiang, S. Choudhury, Z. A. Kudyshev, D. Wang, L. J. Prokopeva, P. Xiao, Y. Jiang, A. V. Kildishev. Enhancing sensitivity to ambient refractive index with tunable few-layer graphene/hBN nanoribbons. Photon. Res., 7, 815-822(2019).
[10] B. Y. Qin, Z. Li, F. R. Hu, C. Hu, T. Chen, H. Zhang, Y. H. Zhao. Highly sensitive detection of carbendazim by using terahertz time-domain spectroscopy combined with metamaterial. IEEE Trans. Terahertz Sci. Technol., 8, 149-154(2018).
[11] G. Govind, M. J. Akhtar. Metamaterial-inspired microwave microfluidic sensor for glucose monitoring in aqueous solutions. IEEE Sens. J., 19, 11900-11907(2019).
[12] H. E. Nejad, A. Mir, A. Armani. Supersensitive and tunable nano-biosensor for cancer detection. IEEE Sens. J., 19, 4874-4881(2019).
[13] S. K. Patel, J. Parmar, V. Sorathiya, R. B. Zakaria, T. K. Nguyen, V. Dhasarathan. Graphene-based plasmonic absorber for biosensing applications using gold split ring resonator metasurfaces. J. Lightwave Technol., 39, 5617-5624(2021).
[14] F. W. Zhan, Y. S. Lin. Tunable multiresonance using complementary circular metamaterial. Opt. Lett., 45, 3633-3636(2020).
[15] C. Shi, X. F. Zang, Y. Q. Wang, L. Chen, B. Cai, Y. M. Zhu. A polarization-independent broadband terahertz absorber. Appl. Phys. Lett., 105, 031104(2014).
[16] M. I. Haftel, C. Schlockermann, G. Blumberg. Role of cylindrical surface plasmons in enhanced transmission. Appl. Phys. Lett., 88, 193104(2006).
[17] W. Withayachumnankul, C. M. Shah, C. Fumeaux, K. Kaltenecker, M. Walther, B. M. Fischer, D. Abbott, M. Bhaskaran, S. Sriram. Terahertz localized surface plasmon resonances in coaxial microcavities. Adv. Opt. Mater., 1, 443-448(2013).
[18] X. G. Zhao, Y. Wang, J. Schalch, G. W. Duan, K. Crernin, J. D. Zhang, C. X. Chen, R. D. Averitt, X. Zhang. Optically modulated ultra-broadband all-silicon metamaterial terahertz absorbers. ACS Photon., 6, 830-837(2019).
[19] S. J. Byrnes. Multilayer optical calculations(2016).
[20] D. R. Smith, D. C. Vier, T. Koschny, C. M. Soukoulis. Electromagnetic parameter retrieval from inhomogeneous metamaterials. Phys. Rev. E, 71, 036617(2005).
[21] X. J. Wu, B. G. Quan, X. C. Pan, X. L. Xu, X. C. Lu, C. Z. Gu, L. Wang. Alkanethiol-functionalized terahertz metamaterial as label-free, highly-sensitive and specific biosensor. Biosens. Bioelectron., 42, 626-631(2013).
[22] S. J. Park, J. T. Hong, S. J. Choi, H. S. Kim, W. K. Park, S. T. Han, J. Y. Park, S. Lee, D. S. Kim, Y. H. Ahn. Detection of microorganisms using terahertz metamaterials. Sci. Rep., 4, 4988(2014).
[23] L. J. Xie, W. L. Gao, J. Shu, Y. B. Ying, J. C. Kono. Extraordinary sensitivity enhancement by metasurfaces in terahertz detection of antibiotics. Sci. Rep., 5, 8671(2015).
[24] D. K. Lee, J. H. Kang, J. S. Lee, H. S. Kim, C. Kim, J. H. Kim, T. Lee, J. H. Son, Q. H. Park, M. Seo. Highly sensitive and selective sugar detection by terahertz nano-antennas. Sci. Rep., 5, 15459(2015).
[25] J. Y. Qin, L. J. Xie, Y. B. Ying. A high-sensitivity terahertz spectroscopy technology for tetracycline hydrochloride detection using metamaterials. Food Chem., 211, 300-305(2016).
[26] F. R. Hu, E. Z. Guo, X. Xu, P. Li, X. L. Xu, S. Yin, Y. E. Wang, T. Chen, X. H. Yin, W. T. Zhang. Real-timely monitoring the interaction between bovine serum albumin and drugs in aqueous with terahertz metamaterial biosensor. Opt. Commun., 388, 62-67(2017).
[27] S. J. Park, S. H. Cha, G. A. Shin, Y. H. Ahn. Sensing viruses using terahertz nano-gap metamaterials. Biomed. Opt. Express, 8, 3551-3558(2017).
[28] B. J. Han, Z. H. Han, J. Y. Qin, Y. M. Wang, Z. S. Zhao. A sensitive and selective terahertz sensor for the fingerprint detection of lactose. Talanta, 192, 1-5(2019).
[29] Y. P. Yang, D. Q. Xu, W. L. Zhang. High-sensitivity and label-free identification of a transgenic genome using a terahertz meta-biosensor. Opt. Express, 26, 31589-31598(2018).
[30] D. K. Lee, J. H. Kang, J. Kwon, J. S. Lee, S. Lee, D. H. Woo, J. H. Kim, C. S. Song, Q. H. Park, M. Seo. Nano metamaterials for ultrasensitive terahertz biosensing. Sci. Rep., 7, 8146(2017).
[31] W. D. Xu, L. J. Xie, J. F. Zhu, L. H. Tang, R. Singh, C. Wang, Y. G. Ma, H. T. Chen, Y. B. Ying. Terahertz biosensing with a graphene-metamaterial heterostructure platform. Carbon, 141, 247-252(2019).
[32] Y. Y. Li, X. Y. Chen, F. R. Hu, D. X. Li, H. Teng, Q. Rong, W. T. Zhang, J. G. Han, H. S. Liang. Four resonators based high sensitive terahertz metamaterial biosensor used for measuring concentration of protein. J. Phys. D, 52, 095105(2019).
[33] H. Zhou, C. Yang, D. L. Hu, D. X. Li, X. D. Hui, F. Zhang, M. Chen, X. J. Mu. Terahertz biosensing based on bi-layer metamaterial absorbers toward ultra-high sensitivity and simple fabrication. Appl. Phys. Lett., 115, 143507(2019).
[34] D. X. Li, S. J. Lin, F. R. Hu, Z. C. Chen, W. T. Zhang, J. G. Han. Metamaterial terahertz sensor for measuring thermal-induced denaturation temperature of insulin. IEEE Sens. J., 20, 1821-1828(2020).
[35] Y. Wang, Z. J. Cui, X. J. Zhang, X. Zhang, Y. Q. Zhu, S. G. Chen, H. Hu. Excitation of surface plasmon resonance on multiwalled carbon nanotube metasurfaces for pesticide sensors. ACS Appl. Mater. Interfaces, 12, 52082-52088(2020).
[36] C. Enkrich, M. Wegener, S. Linden, S. Burger, L. Zschiedrich, F. Schmidt, J. F. Zhou, Th. Koschny, C. M. Soukoulis. Magnetic metamaterials at telecommunication and visible frequencies. Phys. Rev. Lett., 95, 203901(2005).


Set citation alerts for the article
Please enter your email address

© Copyright 2018-2021 | Chinese Laser Press. All Rights Reserved 沪ICP备15018463号-20