• Spectroscopy and Spectral Analysis
  • Vol. 42, Issue 6, 1728 (2022)
Jin-chuan YANG1、*, Jing-long AN1、1; 2;, Cong LI3、3;, Wen-chao ZHU3、3; *;, Bang-dou HUANG4、4; *;, Cheng ZHANG4、4; 5;, and Tao SHAO4、4; 5;
Author Affiliations
  • 11. Key Laboratory of Electromagnetic Field and Electrical Apparatus Reliability of Hebei Province, Hebei University of Technology, Tianjian 300130, China
  • 33. State Key Laboratory of NBC Protection for Civilian, Beijing 102205, China
  • 44. Beijing International S&T Cooperation Base for Plasma Science and Energy Conversion, Institute of Electrical Engineering Chinese Academy of Sciences, Beijing 100190, China
  • show less
    DOI: 10.3964/j.issn.1000-0593(2022)06-1728-07 Cite this Article
    Jin-chuan YANG, Jing-long AN, Cong LI, Wen-chao ZHU, Bang-dou HUANG, Cheng ZHANG, Tao SHAO. Study on Detecting Method of Toxic Agent Containing Phosphorus (Simulation Agent) by Optical Emission Spectroscopy of Atmospheric Pressure Low-Temperature Plasma[J]. Spectroscopy and Spectral Analysis, 2022, 42(6): 1728 Copy Citation Text show less
    Three different excitation source experimental devices(a): Nanosecond pulse; (b): DC self-pulse; (c): Microwave
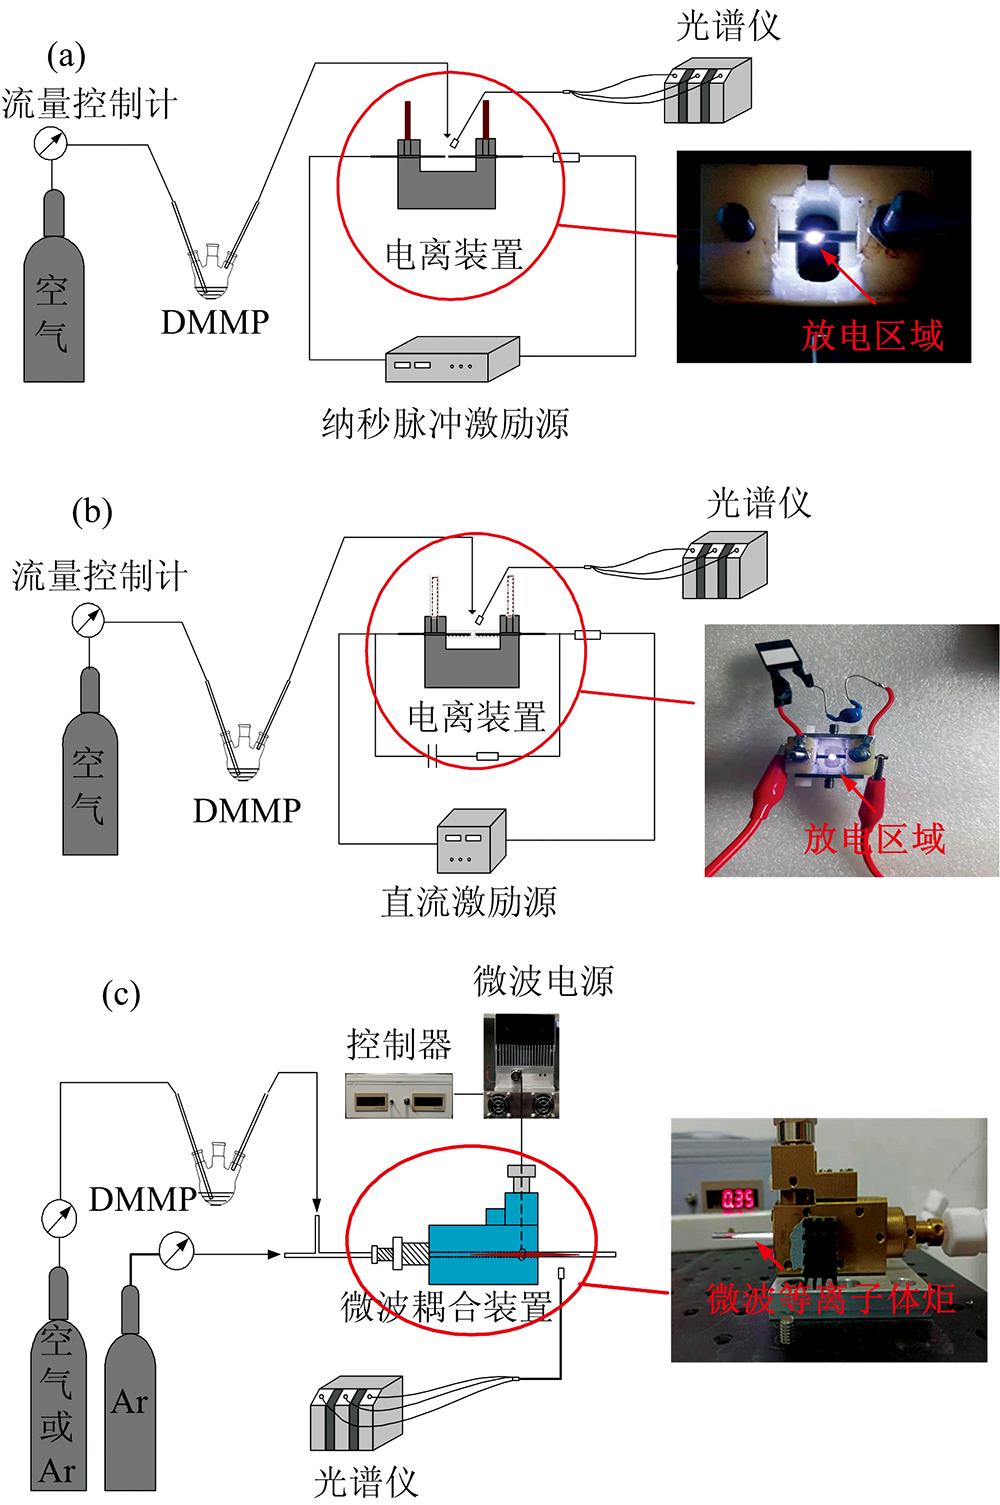
    Fig. 1. Three different excitation source experimental devices
    (a): Nanosecond pulse; (b): DC self-pulse; (c): Microwave
    P atom line and PO molecule band in MW plasma with argon carrier gas
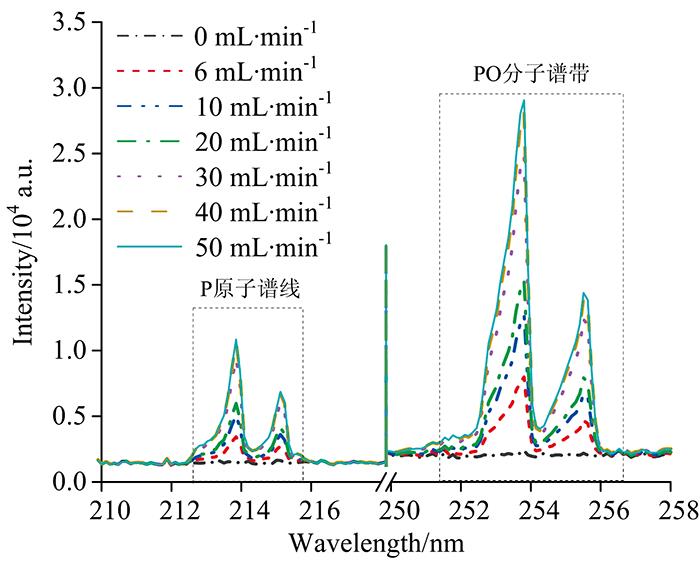
    Fig. 2. P atom line and PO molecule band in MW plasma with argon carrier gas
    OES from Microwave plasma before and after DMMP is introduced(a): Before the introduction of the DMMP;(b): After the introduction of the DMMP
    Fig. 3. OES from Microwave plasma before and after DMMP is introduced
    (a): Before the introduction of the DMMP;(b): After the introduction of the DMMP
    OES of DMMP from nanosecond pulse discharge (a) and DC self-pulse discharge (b)
    Fig. 4. OES of DMMP from nanosecond pulse discharge (a) and DC self-pulse discharge (b)
    Spectra fitting of different excitation sources(a): Microwave; (b): Nanosecond pulse; (c): DC self-pulse
    Fig. 5. Spectra fitting of different excitation sources
    (a): Microwave; (b): Nanosecond pulse; (c): DC self-pulse
    Principal component analysis diagram
    Fig. 6. Principal component analysis diagram
    Linear fitting of frequency and spectral intensity
    Fig. 7. Linear fitting of frequency and spectral intensity
    来源原子/基团跃迁能级
    沙林/DMMPP(213.82 nm)3s23p2(3P)
    4s3/2→3s23p3 3/2
    沙林/DMMPP(215.09 nm)3s23p2(1D)
    4s5/2→3s23p3 3/2
    沙林/DMMPPO(253.67, 255.6 nm)A2Σ+→X2Π
    Table 1. Characteristic OES of sarin and DMMP simulant
    激励源转动温度Tr/K振动温度Tv/K
    微波1 3002 100
    纳秒脉冲9804 100
    直流自脉冲8803 500
    Table 2. Fitting temperature of different excitation sources
    激励源形式特点气氛
    微波无电极谱线纯净氩气
    纳秒脉冲针-针电极本底强烈空气
    直流自脉冲针-针电极本底强烈空气
    Table 3. Comparison of different excitation sources
    主成分特征值贡献率/%累计贡献率/%
    PC14.14×101073.573.5
    PC21.04×101018.692.1
    Table 4. Eigenvalues and contribution rate of principal components
    Jin-chuan YANG, Jing-long AN, Cong LI, Wen-chao ZHU, Bang-dou HUANG, Cheng ZHANG, Tao SHAO. Study on Detecting Method of Toxic Agent Containing Phosphorus (Simulation Agent) by Optical Emission Spectroscopy of Atmospheric Pressure Low-Temperature Plasma[J]. Spectroscopy and Spectral Analysis, 2022, 42(6): 1728
    Download Citation