
Yi Yu, Hui Li, Minghui Xu, Yuntao Wu. High-Resolution Light Field Display Simulation Based on Frequency Domain Translation[J]. Laser & Optoelectronics Progress, 2022, 59(1): 0107001
- Laser & Optoelectronics Progress
- Vol. 59, Issue 1, 0107001 (2022)
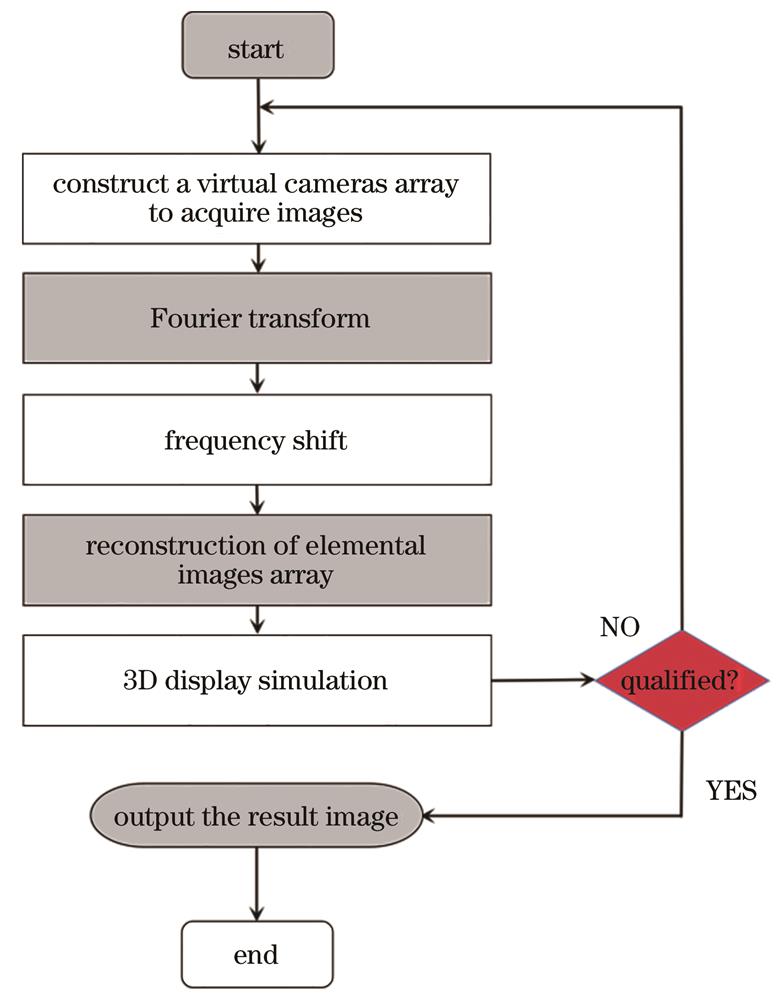
Fig. 1. Flow chart of light field display simulation
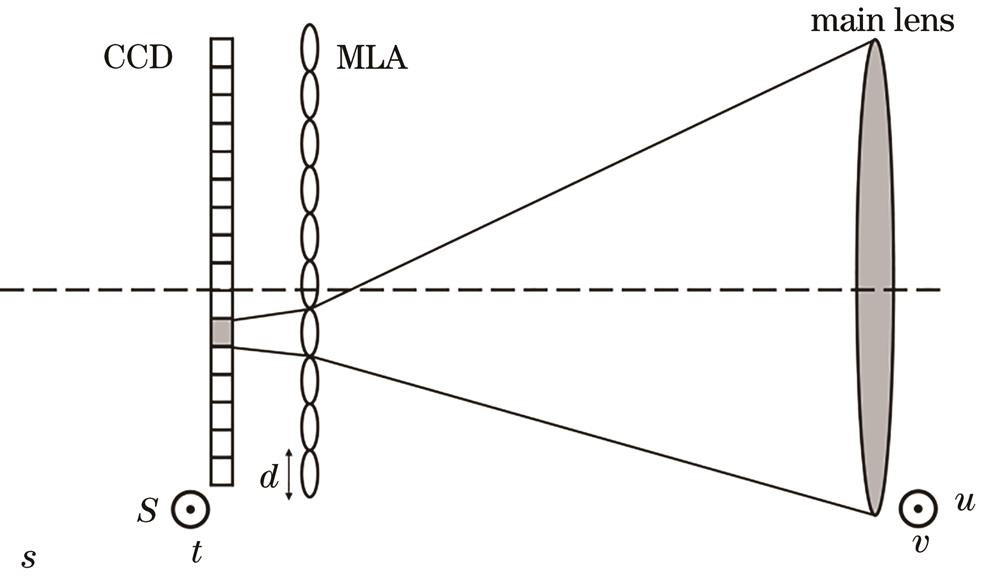
Fig. 2. Light field collection based on micro-lens array
Fig. 3. Light field collection based on virtual camera array
Fig. 4. Processing steps of producing the new EIA by the FDT theory
Fig. 5. Process of time division multiplexing
Fig. 6. Simulation images with the proposed FDT technique shown in the display screen. (a)~(c) Renders of original 3D objects; (d)~(f) elemental image array; (g)~(i) display results obtained by FDT method
Fig. 7. Comparative result images with different values of shift. (a) 1 pitch; (b) 0.75 pitch; (c) 0.5 pitch; (d) 0.25 pitch; (e)~(h) four different cases of (a)~(d)
Fig. 8. Simulation result based on the FDT theory. (a) EIA of "Teapot"; (b) new EIA of "Teapot" obtained by FDT theory; (c) and (d) local enlarged image of (a) and (b); (e) parallax of (c) and (d); (f) 4D Fourier transform result of (a); (g) 4D Fourier transform result of (b); (h) and (i) local enlarged image of (f) and (g); (j) correlation spectrum phase result of (a) and (b); (k) and (l) displayed results of (a) and (b)
Fig. 9. Comparative result images of various methods. (a) and (e) frequency domain translation; (b) and (f) Fourier volumetric computational reconstruction (FVCR); (c) and (g) synthetic aperture integral imaging display simulation with moving array lenslets technique; (d) and (h) matrix optics light field near-eye display(MOLF-NED)
Fig. 10. Render time consuming of various simulation results
|
Table 1. Image quality comparison

Set citation alerts for the article
Please enter your email address
© Copyright 2018-2021 | Chinese Laser Press. All Rights Reserved 沪ICP备15018463号-20