• Acta Optica Sinica
  • Vol. 37, Issue 8, 0830002 (2017)
Tao Wu1、2、*, Dong Xu1、2, Xingdao He1、2, Rong Lai1、2, and Tao Cheng1、2
Author Affiliations
  • 1 Jiangxi Engineering Laboratory for Optoelectronic Testing Technology, Nanchang Hangkong University, Nanchang, Jiangxi 330063, China
  • 2 National Engineering Laboratory for Nondestructive Testing and Optoelectronic Sensing Technology and Application, Nanchang Hangkong University, Nanchang, Jiangxi 330063, China
  • show less
    DOI: 10.3788/AOS201737.0830002 Cite this Article Set citation alerts
    Tao Wu, Dong Xu, Xingdao He, Rong Lai, Tao Cheng. Off-Axis Integrated Cavity Output Spectroscopy Technique Based on Wavelength Modulation[J]. Acta Optica Sinica, 2017, 37(8): 0830002 Copy Citation Text show less
    Schematic of WM-OA-ICOS measurement system
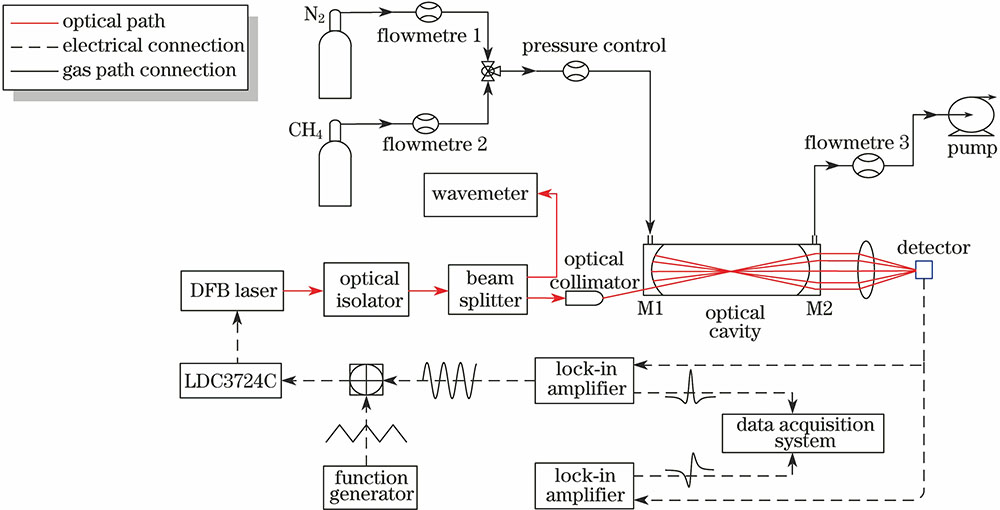
    Fig. 1. Schematic of WM-OA-ICOS measurement system
    Simulation of CH4 and H2O absorbance near 7185.87 cm-1 using HITRAN 2012 database
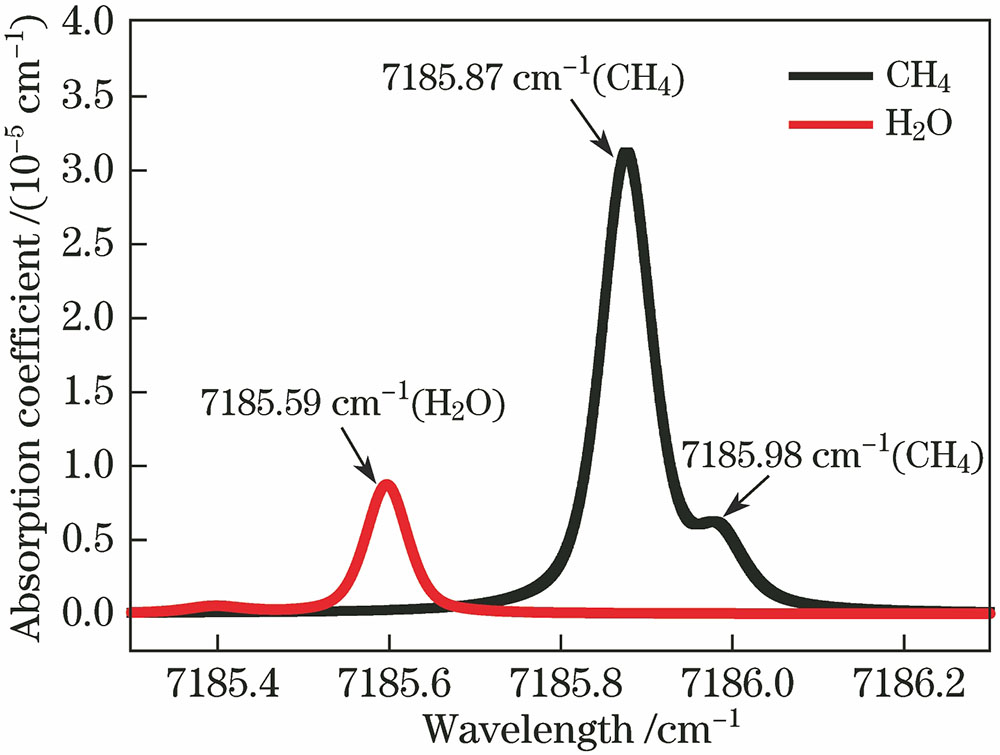
    Fig. 2. Simulation of CH4 and H2O absorbance near 7185.87 cm-1 using HITRAN 2012 database
    Relationship between modulation amplitude and 2f signal peak height at different pressures
    Fig. 3. Relationship between modulation amplitude and 2f signal peak height at different pressures
    Variations of 2f signal peak height with (a) modulation phase and (b) modulation frequency
    Fig. 4. Variations of 2f signal peak height with (a) modulation phase and (b) modulation frequency
    (a) Relationship between 2f signal peak height and time; (b) Allan variance
    Fig. 5. (a) Relationship between 2f signal peak height and time; (b) Allan variance
    Waveforms of (a) 2f signal and (b) 1f signal at different CH4 concentrations
    Fig. 6. Waveforms of (a) 2f signal and (b) 1f signal at different CH4 concentrations
    Measured (a) 2f signal peak height and (b) 1f signal medium value over a long period of measurement for CH4 of ten different concentrations
    Fig. 7. Measured (a) 2f signal peak height and (b) 1f signal medium value over a long period of measurement for CH4 of ten different concentrations
    Variations of 2f signal peak height and the ratio of 2f signal peak height to 1f signal medium value (2f/1f) with CH4 concentration
    Fig. 8. Variations of 2f signal peak height and the ratio of 2f signal peak height to 1f signal medium value (2f/1f) with CH4 concentration
    (a) Variations of 2f signal peak height and 2f/1f value with time; (b) linear relationship between 2f signal peak height or 2f/1f value and CH4 concentration
    Fig. 9. (a) Variations of 2f signal peak height and 2f/1f value with time; (b) linear relationship between 2f signal peak height or 2f/1f value and CH4 concentration
    (a) Absorption line of CH4 and (b) fitting residual obtained by OA-ICOS technique
    Fig. 10. (a) Absorption line of CH4 and (b) fitting residual obtained by OA-ICOS technique
    2f signal obtained by WM-OA-ICOS technique
    Fig. 11. 2f signal obtained by WM-OA-ICOS technique
    Tao Wu, Dong Xu, Xingdao He, Rong Lai, Tao Cheng. Off-Axis Integrated Cavity Output Spectroscopy Technique Based on Wavelength Modulation[J]. Acta Optica Sinica, 2017, 37(8): 0830002
    Download Citation