• Spectroscopy and Spectral Analysis
  • Vol. 42, Issue 11, 3642 (2022)
Hai-lan LIN1、*, Zhong-ting HUANG1、1; *;, Yang CHEN2、2;, Tao YU1、1;, Yun-bo YANG2、2;, Jun-ping BI1、1;, and Pei LIU1、1;
Author Affiliations
  • 11. Hunan Province Environmental Monitoring Center, State Environmental Protection Key Laboratory of Monitoring for Heavy Metal Pollutants, Changsha 410019, China
  • 22. Lihe Technology (Hunan) Co., Ltd., Changsha 410205, China
  • show less
    DOI: 10.3964/j.issn.1000-0593(2022)11-3642-05 Cite this Article
    Hai-lan LIN, Zhong-ting HUANG, Yang CHEN, Tao YU, Yun-bo YANG, Jun-ping BI, Pei LIU. Application of LEFC-2006 in Thallium Monitoring of Water Quality[J]. Spectroscopy and Spectral Analysis, 2022, 42(11): 3642 Copy Citation Text show less
    The basic structure diagram of instrument
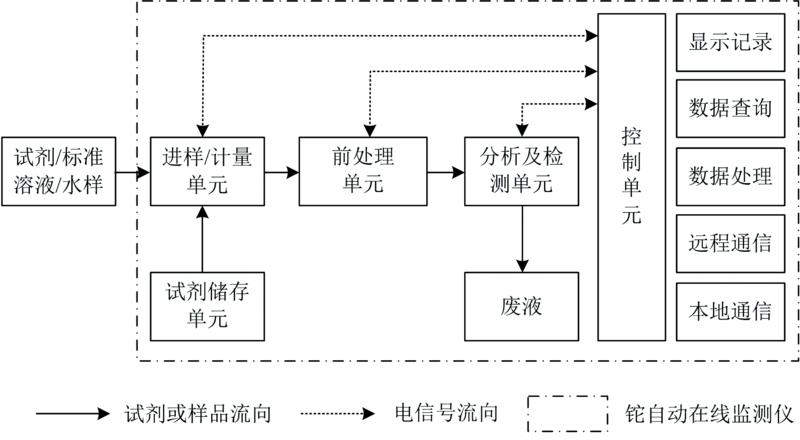
    Fig. 1. The basic structure diagram of instrument
    1234567平均值SD方法检出限方法测定下限
    测定值0.0520.0530.0480.0460.0440.0460.0490.0480.0030.020.08
    Table 1. Results of test for detection limits (μg·L-1)
    平行号标液1标液2标液3
    10.0970.9955.24
    20.0960.9935.13
    30.0961.015.07
    40.0960.9835.24
    50.0930.9965.20
    60.0891.015.10
    平均值0.0951.005.14
    有证标准物质浓度0.101.005.00
    相对误差/%-5.5-0.172.9
    Table 2. Accuracy results of thallium (μg·L-1)
    地表
    水1
    地表
    水2
    地表
    水3
    废水
    1
    废水
    2
    废水
    3
    废水
    4
    10.260.0610.03513621.019.41.38
    20.240.0650.03213421.118.71.41
    30.220.0640.03213422.218.71.40
    40.260.0610.03213520.518.41.42
    50.240.0640.03313420.618.41.47
    60.250.0620.03613620.820.71.46
    平均值0.250.0630.03313521.019.11.42
    SD0.0150.001 70.001 80.800.640.880.035
    RSD/%6.22.75.30.603.04.62.5
    Table 3. Precision results of thallium in actual samples (μg·L-1)
    水质类别点位名称测试结果
    地表水3原液测试值/(μg·L-1)0.033
    加标测试值/(μg·L-1)0.0700.119
    加标量/(μg·L-1)0.0300.080
    加标回收率/%123108
    地表水4原液测试值/(μg·L-1)0.063
    加标测试值/(μg·L-1)0.1390.144
    加标量/(μg·L-1)0.060.08
    加标回收率/%127101
    废水4测试值/(μg·L-1)1.42
    加标测试值/(μg·L-1)2.97
    加标量/(μg·L-1)1.50
    加标回收率/%103
    Table 4. Recoveries of thallium in actual samples (n=6)
    水质
    类型
    样品
    点位
    测试值ICP-MS
    LFEC-2006
    (Tl)
    两个方法
    相对偏差
    地表水1平均值0.2180.2455.8
    SD0.0160.015/
    RSD/%7.56.2/
    2平均值0.0340.06330
    SD0.000 60.001 7/
    RSD/%1.92.7/
    3平均值0.0280.0338.7
    SD0.000 00.001 8/
    RSD/%0.005.3/
    废水1平均值1221354.8
    SD0.990.80/
    RSD/%0.810.60/
    2平均值18.921.05.3
    SD0.240.64/
    RSD/%1.33.0/
    3平均值18.719.10.85
    SD0.330.88/
    RSD/%1.84.6/
    4平均值1.271.425.6
    SD0.0240.035/
    RSD/%1.92.5/
    Table 5. Comparison and analysis of precision data between LFEC-2006(Tl) and ICP-MS (n=6)
    序号样品编号ICP-MS
    LFEC-2006
    (Tl)
    相对误
    差/%
    120210418-3#-80.06<0.02/
    220210418-3#-90.07<0.02/
    320210418-3#-100.06<0.02/
    420210418-3#-110.06<0.02/
    520210418-1#-80.880.795-9.7
    620210418-1#-90.820.799-2.6
    720210418-1#-101.091.188.0
    820210418-1#-111.251.18-5.6
    920210418-17#-90.07<0.02/
    1020210820-1#-80.0340.030-12
    1120210820-1#-90.0380.030-21
    1220210820-2#-80.0650.08429
    1420210820-2#-90.0680.07612
    1520210820-3#-80.0540.06215
    1620210820-3#-90.0550.0585.5
    1720210820-4#-80.5780.5820.69
    1820210820-4#-90.5620.535-4.8
    1920210820-5#-82.052.228.3
    2020210820-5#-91.982.043.0
    Table 6. Comparative data of thallium automatic analyzer and ICP-MS (μg·L-1)
    Hai-lan LIN, Zhong-ting HUANG, Yang CHEN, Tao YU, Yun-bo YANG, Jun-ping BI, Pei LIU. Application of LEFC-2006 in Thallium Monitoring of Water Quality[J]. Spectroscopy and Spectral Analysis, 2022, 42(11): 3642
    Download Citation