• Spectroscopy and Spectral Analysis
  • Vol. 42, Issue 9, 2774 (2022)
Shi-jie LIU*, Yao-di ZHU1; 2;, Miao-yun LI1; 2; *;, Gai-ming ZHAO1; 2;, Li-jun ZHAO1; 2;, Yang-yang MA1; 2;, and Na WANG1;
Author Affiliations
  • 1. College of Food Science and Technology, Henan Agricultural University, Zhengzhou 450000, China
  • show less
    DOI: 10.3964/j.issn.1000-0593(2022)09-2774-07 Cite this Article
    Shi-jie LIU, Yao-di ZHU, Miao-yun LI, Gai-ming ZHAO, Li-jun ZHAO, Yang-yang MA, Na WANG. Raman Spectroscopic Characteristic Structure Analysis and Rapid Identification of Food-Borne Pathogen Spores Based on SERS Technology[J]. Spectroscopy and Spectral Analysis, 2022, 42(9): 2774 Copy Citation Text show less
    Phase-contrast microscopic image of three food-borne pathogenic bacteria spores
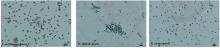
    Fig. 1. Phase-contrast microscopic image of three food-borne pathogenic bacteria spores
    UV-Vis absorption spectrum (a), particle size distribution (b) and TEM image (c) of AgNPs
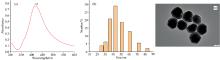
    Fig. 2. UV-Vis absorption spectrum (a), particle size distribution (b) and TEM image (c) of AgNPs
    SERS enhancement effect of AgNPs on three food-borne pathogenic bacteria spores
    Fig. 3. SERS enhancement effect of AgNPs on three food-borne pathogenic bacteria spores
    SERS average fingerprints of three food-borne pathogenic bacteria spores
    Fig. 4. SERS average fingerprints of three food-borne pathogenic bacteria spores
    Repeatability test of SERS spectra of three food-borne pathogenic bacteria spores
    Fig. 5. Repeatability test of SERS spectra of three food-borne pathogenic bacteria spores
    Two-dimensional scatter plot of principal component analysis (PCA) of SERS maps of spores of three food-borne pathogens
    Fig. 6. Two-dimensional scatter plot of principal component analysis (PCA) of SERS maps of spores of three food-borne pathogens
    HCA resulting dendrogram of SERS maps of spores of three food-borne pathogens
    Fig. 7. HCA resulting dendrogram of SERS maps of spores of three food-borne pathogens
    拉曼位移/cm-1
    (本研究)
    拉曼位移/cm-1
    (文献资料)
    峰位归属C. perfringens
    spores
    C. difficile
    spores
    B. cereus
    spores
    425~434481碳水化合物的骨架模式(淀粉)+++
    553~559540~560S—S拉伸(蛋白质)++++++
    657~663662Ca2+-DPA++++
    774~778776腺嘧啶或尿嘧啶(核酸)++++++
    818~820810~827Ca2+-DPA+++
    890880~900=C—O—C=拉伸-+-
    936930~957磷脂N—C拉伸+--
    1 0171 017Ca2+-DPA++++++++++++
    1 091~1 0981092O=P—O伸缩振动(核酸)+++++++
    1 233~1 2361 220~1 248C—H2拉伸振动+++
    1 2711 273酰胺Ⅲ(蛋白质)+--
    1 2941 297CH2变形振动(脂质)++--
    1 327~1 3311 323~1 334C—H变形振动(蛋白质)+++
    1 389~1 3931 393, 1 397Ca2+-DPA+++++
    1 441~1 4491 445, 1 448Ca2+-DPA++++++
    1 572~1 5761 570~1 576Ca2+-DPA+++++++++
    1 6091 616酪氨酸(蛋白质)+--
    1 6491 655酰胺Ⅰ(蛋白质)++--
    1 661~1 6691 665酰胺Ⅰ(不饱和脂质)++++++
    1 768~1 7721 745酯的C=O基团伸缩++-
    Table 1. Tentative attribution of Raman shift of SERS spectra of three food-borne pathogenic bacteria spores
    特征峰编号C. perfringens sporesC. difficile sporesB. cereus spores
    C1691.56±111.44b3 203.56±114.32a514.07±164.20c
    C21 627.82±110.73b2 961.78±116.63a-
    C312 848.73±122.95b16 867.77±129.82a11 035.27±174.48c
    C42 364.93±135.98b3 536.54±141.93a760.33±200.46c
    C55 252.11±137.85b7 083.81±145.53a4 860.83±201.51c
    C68 317.11±136.46b8 849.84±151.83a6 924.89±197.80c
    Table 2. Comparison of six characteristic peaks of Ca2+-DPA in SERS spectra of three spores
    Shi-jie LIU, Yao-di ZHU, Miao-yun LI, Gai-ming ZHAO, Li-jun ZHAO, Yang-yang MA, Na WANG. Raman Spectroscopic Characteristic Structure Analysis and Rapid Identification of Food-Borne Pathogen Spores Based on SERS Technology[J]. Spectroscopy and Spectral Analysis, 2022, 42(9): 2774
    Download Citation