• Laser & Optoelectronics Progress
  • Vol. 55, Issue 12, 122801 (2018)
Huihui Ju, Zhigang Liu*, and Yang Wang
Author Affiliations
  • Institute of Nuclear Engineering, Rocket Force Engineering University, Xi'an, Shaanxi 710025, China
  • show less
    DOI: 10.3788/LOP55.122801 Cite this Article Set citation alerts
    Huihui Ju, Zhigang Liu, Yang Wang. Hyperspectral Anomaly Detection Algorithm Based on Combination of Spectral and Spatial Information[J]. Laser & Optoelectronics Progress, 2018, 55(12): 122801 Copy Citation Text show less
    Illustration of calculating pixel's spectral anomaly index and spatial structure anomaly index
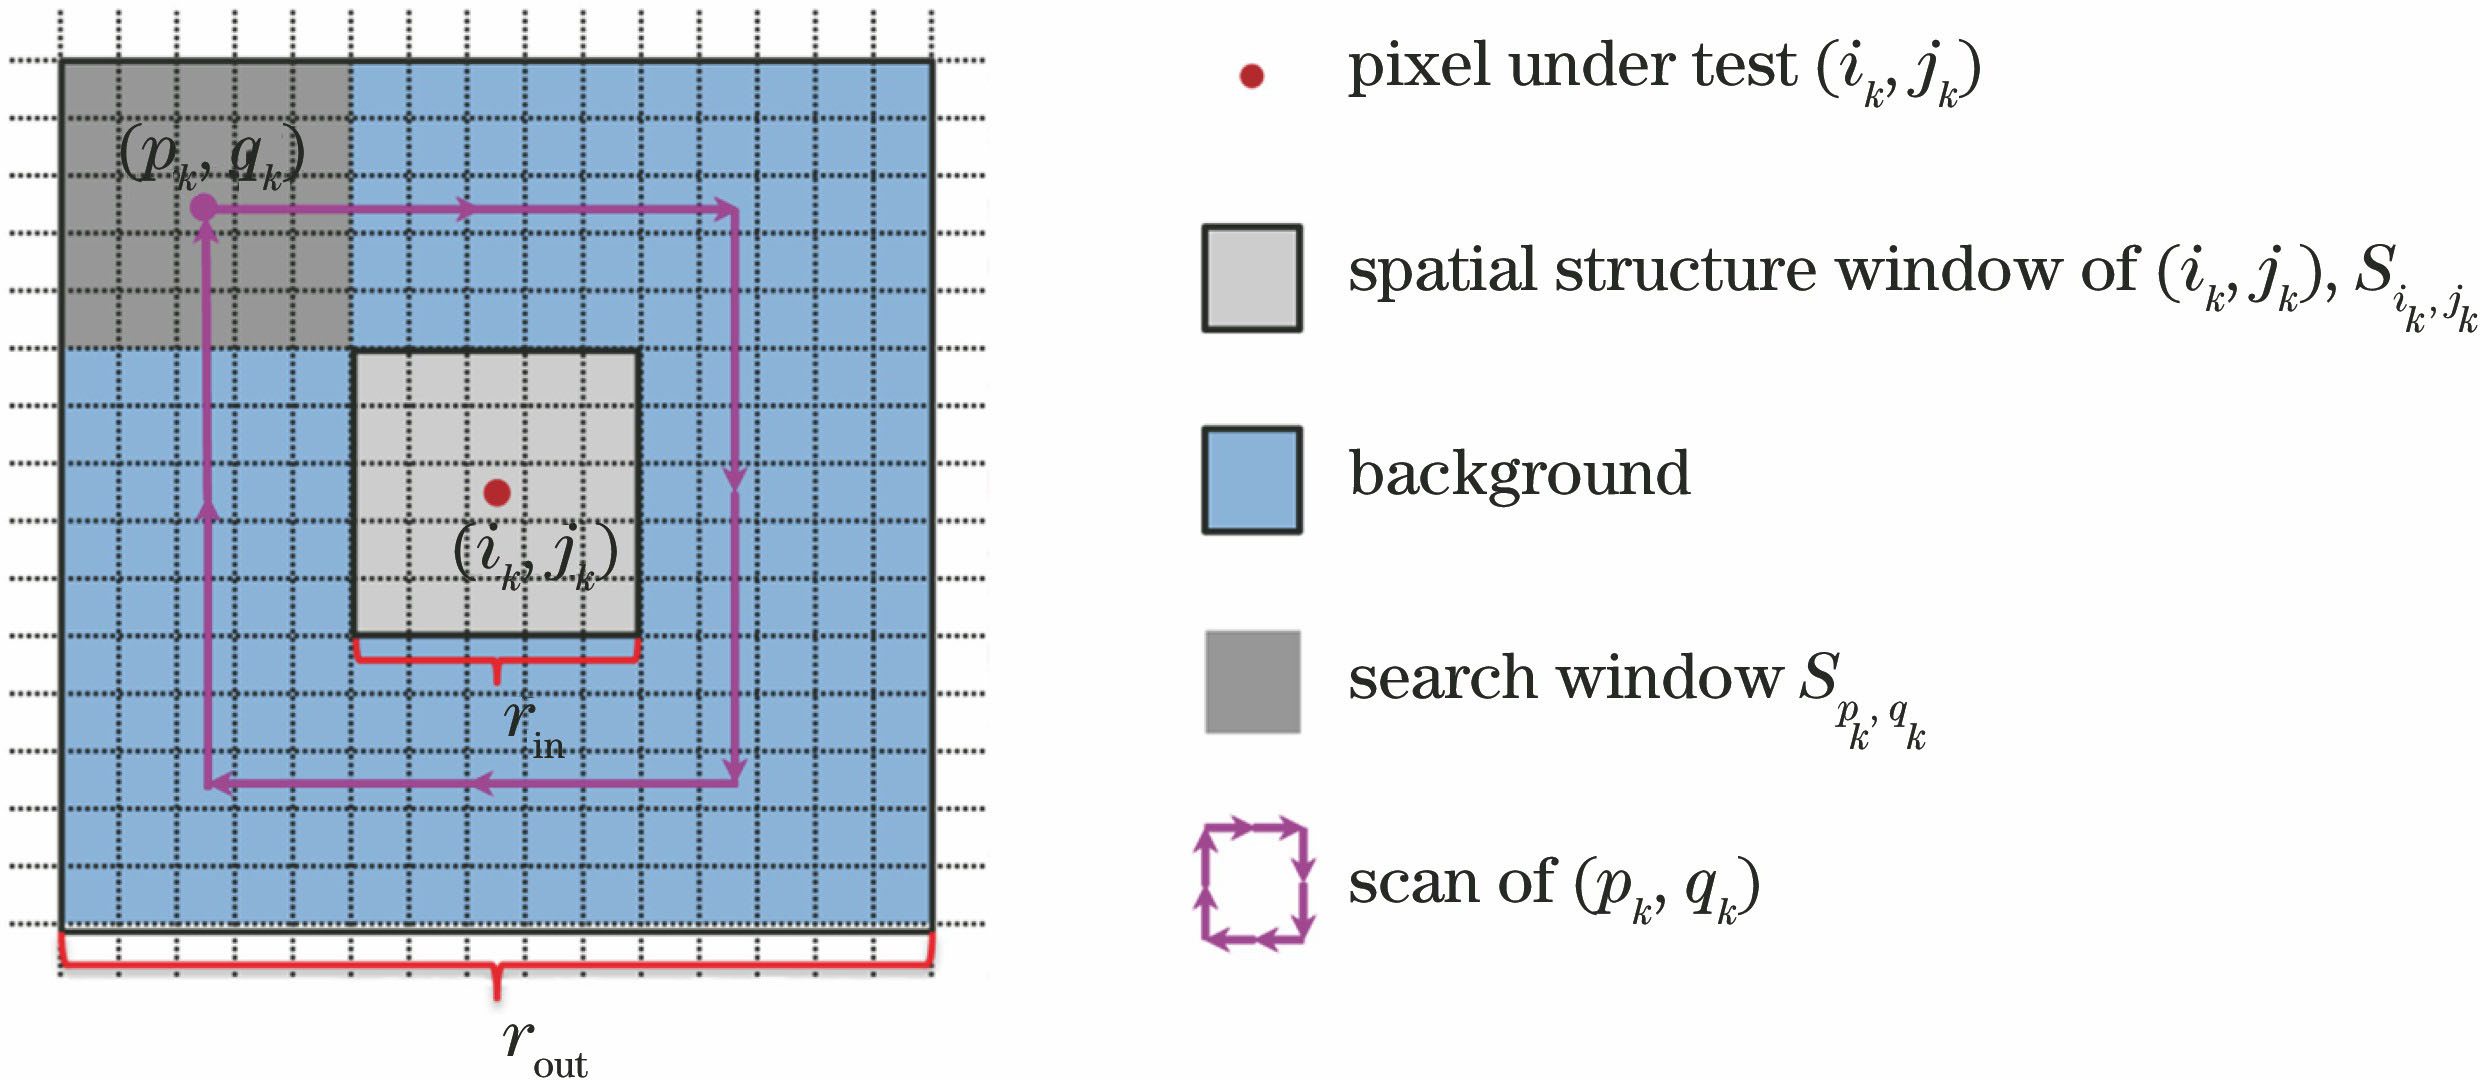
    Fig. 1. Illustration of calculating pixel's spectral anomaly index and spatial structure anomaly index
    Flow chart of SSAD algorithm
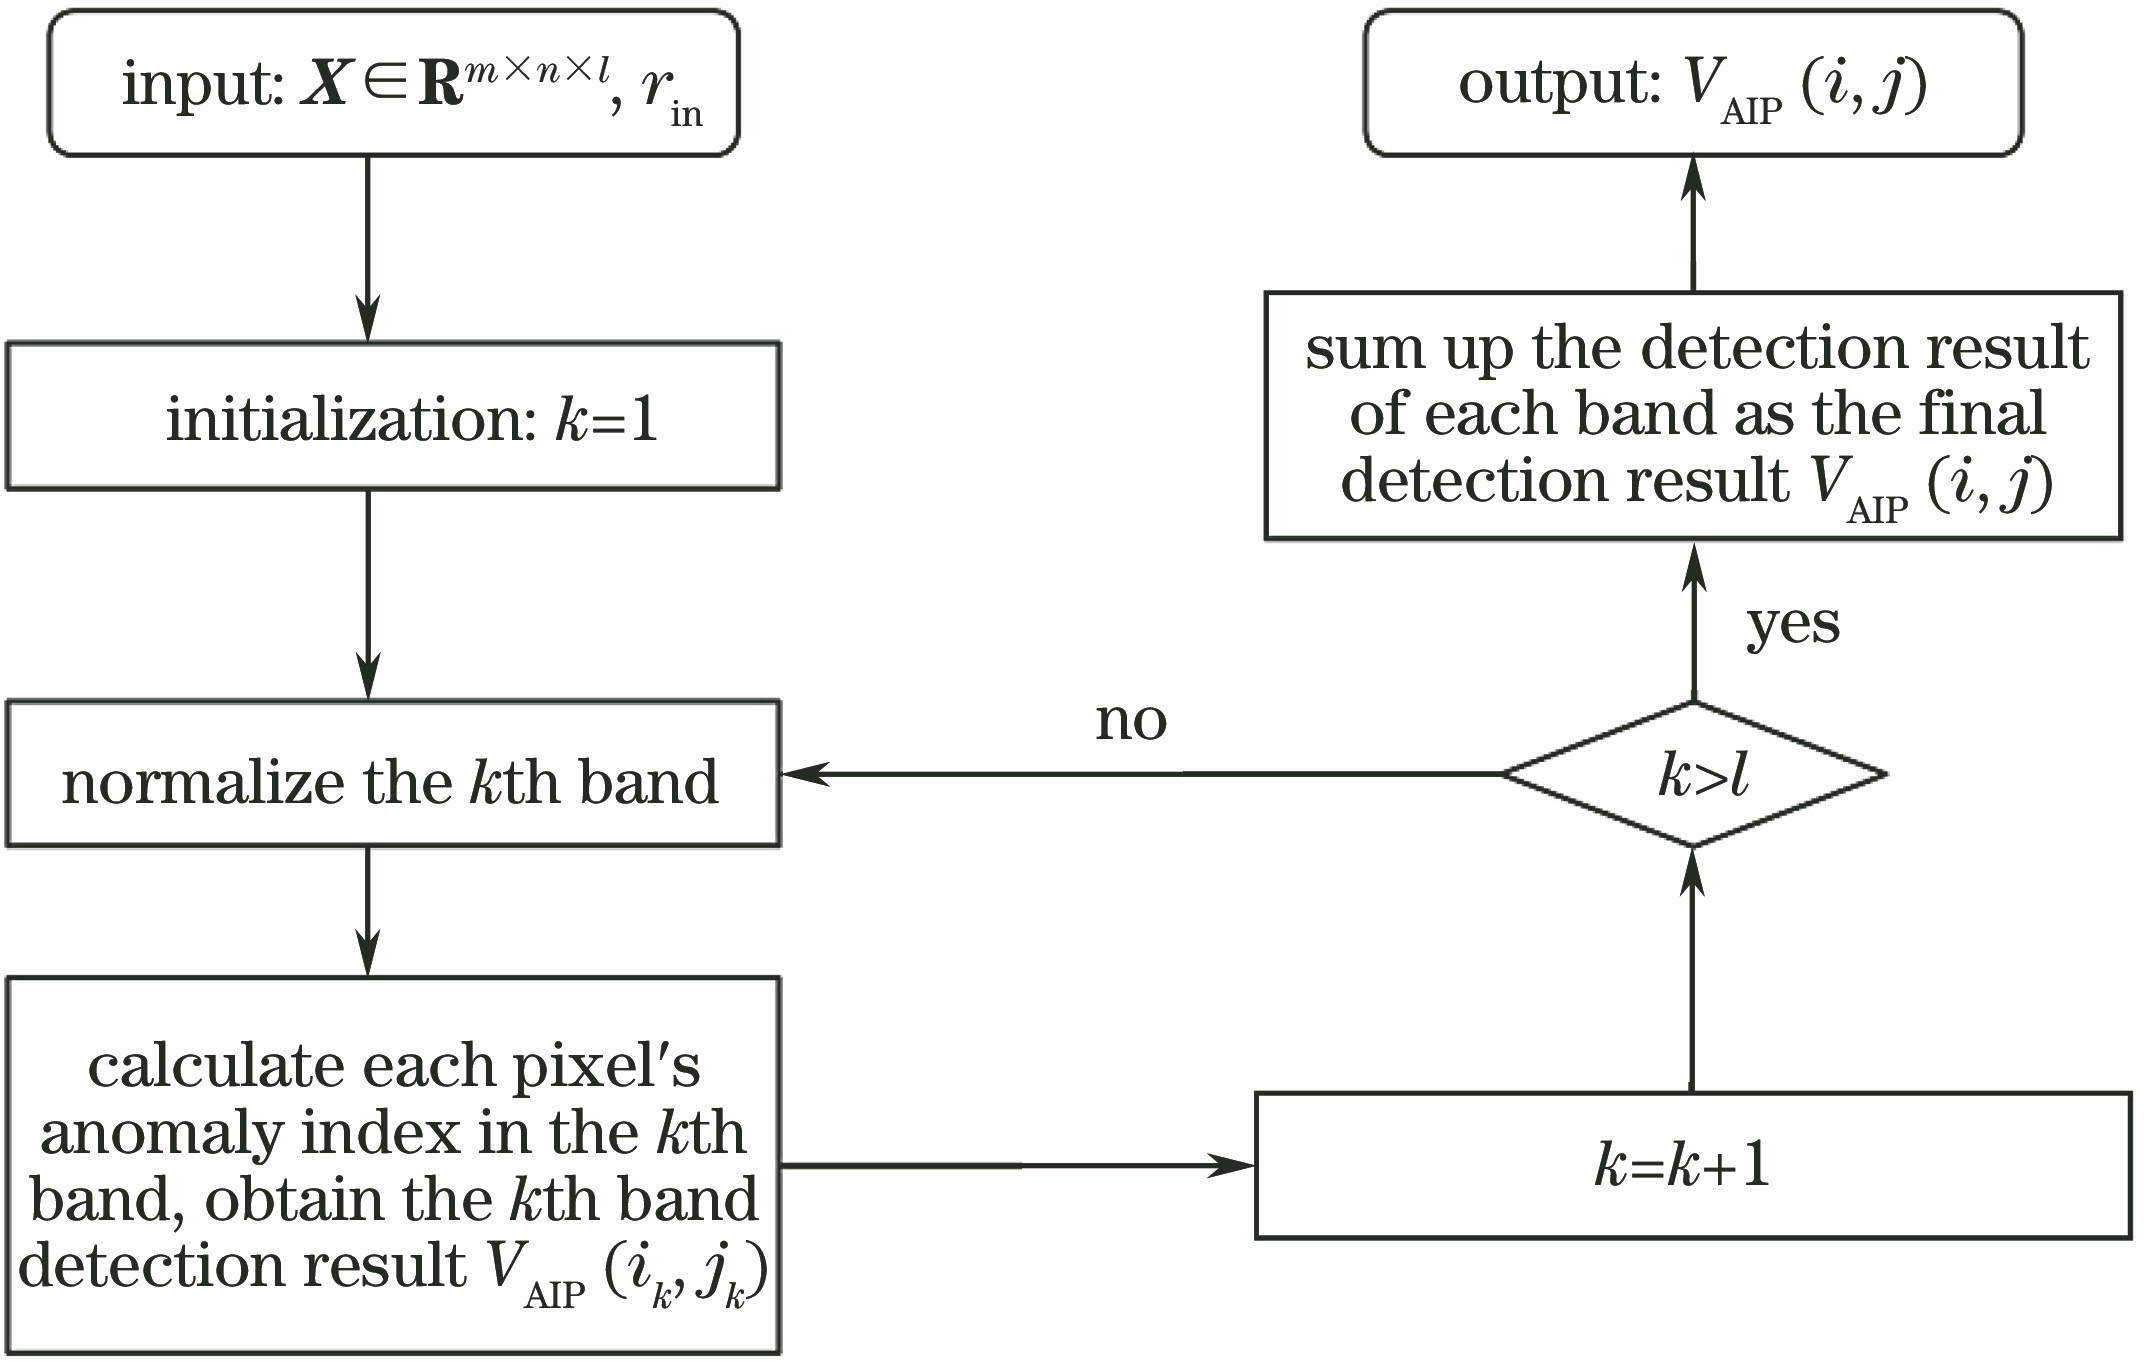
    Fig. 2. Flow chart of SSAD algorithm
    Experimental data 1. (a) Grey-scale map of the 130th band image; (b) spatial distribution map of targets
    Fig. 3. Experimental data 1. (a) Grey-scale map of the 130th band image; (b) spatial distribution map of targets
    Experimental data 2. (a) Grey-scale map of the 30th band image; (b) spatial distribution map of targets
    Fig. 4. Experimental data 2. (a) Grey-scale map of the 30th band image; (b) spatial distribution map of targets
    Experimental data 3. (a) Grey-scale map of the 100th band image; (b) spatial distribution map of targets
    Fig. 5. Experimental data 3. (a) Grey-scale map of the 100th band image; (b) spatial distribution map of targets
    Comparison of detection results on data 1 with different anomaly detection algorithms. (a) RX algorithm; (b) CRD algorithm; (c) LSMAD algorithm; (d) SSAD algorithm
    Fig. 6. Comparison of detection results on data 1 with different anomaly detection algorithms. (a) RX algorithm; (b) CRD algorithm; (c) LSMAD algorithm; (d) SSAD algorithm
    Comparison of detection results on data 2 with different anomaly detection algorithms. (a) RX algorithm; (b) CRD algorithm; (c) LSMAD algorithm; (d) SSAD algorithm
    Fig. 7. Comparison of detection results on data 2 with different anomaly detection algorithms. (a) RX algorithm; (b) CRD algorithm; (c) LSMAD algorithm; (d) SSAD algorithm
    Comparison of detection results on data 3 with different anomaly detection algorithms. (a) RX algorithm; (b) CRD algorithm; (c) LSMAD algorithm; (d) SSAD algorithm
    Fig. 8. Comparison of detection results on data 3 with different anomaly detection algorithms. (a) RX algorithm; (b) CRD algorithm; (c) LSMAD algorithm; (d) SSAD algorithm
    Comparison of ROC curves for different anomaly detection algorithms. (a) Data 1; (b) data 2; (c) data 3
    Fig. 9. Comparison of ROC curves for different anomaly detection algorithms. (a) Data 1; (b) data 2; (c) data 3
    Inner windowsize /(pixel×pixel)Data 1Data 2Data 3
    AUCExecution time /sAUCExecution time /sAUCExecution time /s
    3×30.991213.930.90429.8620.99987.010
    5×50.996016.100.863311.300.99978.039
    7×70.996018.700.794913.200.99939.315
    9×90.994921.770.715115.640.999310.85
    11×110.994325.600.647018.170.998912.52
    Table 1. Effect of inner window size on SSAD algorithm detection performance
    AlgorithmData 1Data 2Data 3
    AUCExecution time /sAUCExecution time /sAUCExecution time /s
    RX0.80032.4880.70731.6700.99831.280
    CRD0.9931585.60.9260102.60.996263.09
    LSMAD0.88208.4010.41216.9300.99953.766
    SSAD0.996016.100.90429.8860.99987.010
    Table 2. AUC and execution time of different anomaly detection algorithms
    Huihui Ju, Zhigang Liu, Yang Wang. Hyperspectral Anomaly Detection Algorithm Based on Combination of Spectral and Spatial Information[J]. Laser & Optoelectronics Progress, 2018, 55(12): 122801
    Download Citation