
Qingyang Hu, Ho-kwang Mao. Born’s valence force-field model for diamond at terapascals: Validity and implications for the primary pressure scale[J]. Matter and Radiation at Extremes, 2021, 6(6): 068403
- Matter and Radiation at Extremes
- Vol. 6, Issue 6, 068403 (2021)
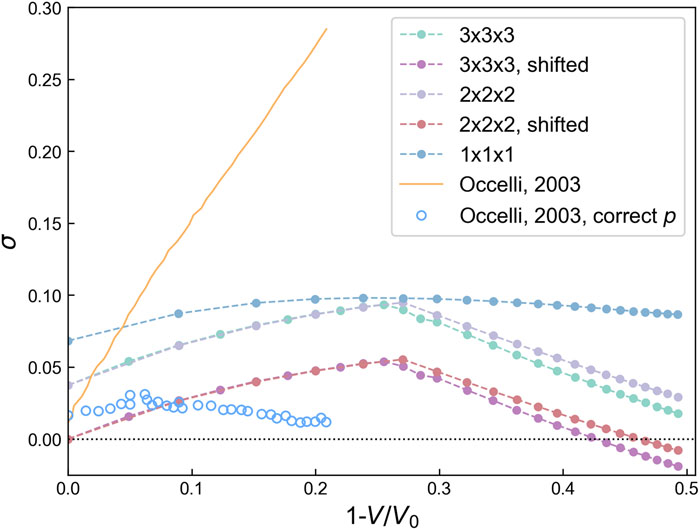
Fig. 1. Uncertainty σ plotted vs volume change. The bulk modulus calculated for 3 × 3 × 3 and 2 × 2 × 2 supercells was also corrected for V 0 zero-volume shift, and the shifted results are plotted in different colors (purple and red curves, respectively). The orange curve shows the fitted data from Occelli et al. 25 The open circles are experimental data from Occelli et al. 25 with a correction for pressure according to Eq. (8) .
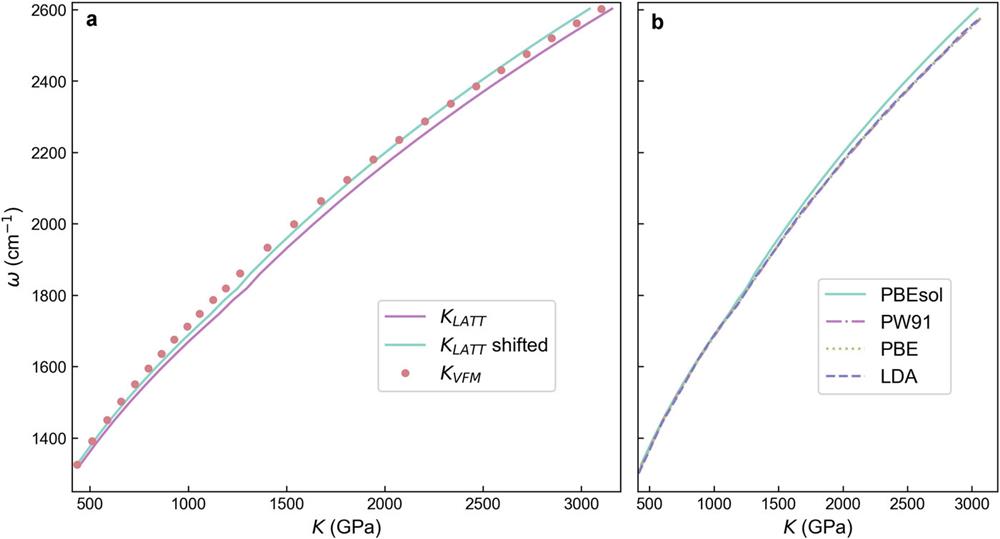
Fig. 2. Frequency of diamond F 2g mode vs bulk modulus K . (a) Comparison of the bulk modulus calculated from the strain–stress relation (K LATT) that calculated from the VFM (K VFM), and K LATT after the application of a zero-shift. (b) Diamond Raman frequency vs K LATT after application of a zero-shift, for different exchange-correlation functionals in the pseudopotential.
Fig. 3. Diamond Raman peak vs accumulated pressure. The results from the VFM (open circles) and DFPT (solid circles) are compared with results obtained by Fratanduono et al. 6 (red solid and dashed lines) and Akahama and Kawamura29 (blue solid and dashed lines) using diamond Raman edge gauges and by Dubrovinskaia et al. 30 (green solid and dashed lines) using a polycrystalline diamond gauge. The blue shaded region represents the theoretical uncertainty. For the diamond Raman edge gauges, the behavior as a function of pressure is divided into high-pressure (HP, >300 GPa) and low-pressure (LP, <300 GPa) regimes.
Fig. 4. Pressure residual vs integrated pressure. For our theoretical calculation, we used the Pulay stress as the standard pressure. For the results of Occelli et al. 25 (also shown on an expanded scale in the inset), the integrated pressure is compared against an experimental ruby gauge. p std, standard pressure.


Set citation alerts for the article
Please enter your email address

© Copyright 2018-2021 | Chinese Laser Press. All Rights Reserved 沪ICP备15018463号-20