
Teng Zhang, Xiaying Meng, Wenqiang Gao, Hongli Wang, Qinglin Niu. Detectability of Low Characteristic Aircraft Based on Different Ground-Based Infrared Visual Range Prediction Models[J]. Acta Optica Sinica, 2024, 44(6): 0604001
- Acta Optica Sinica
- Vol. 44, Issue 6, 0604001 (2024)
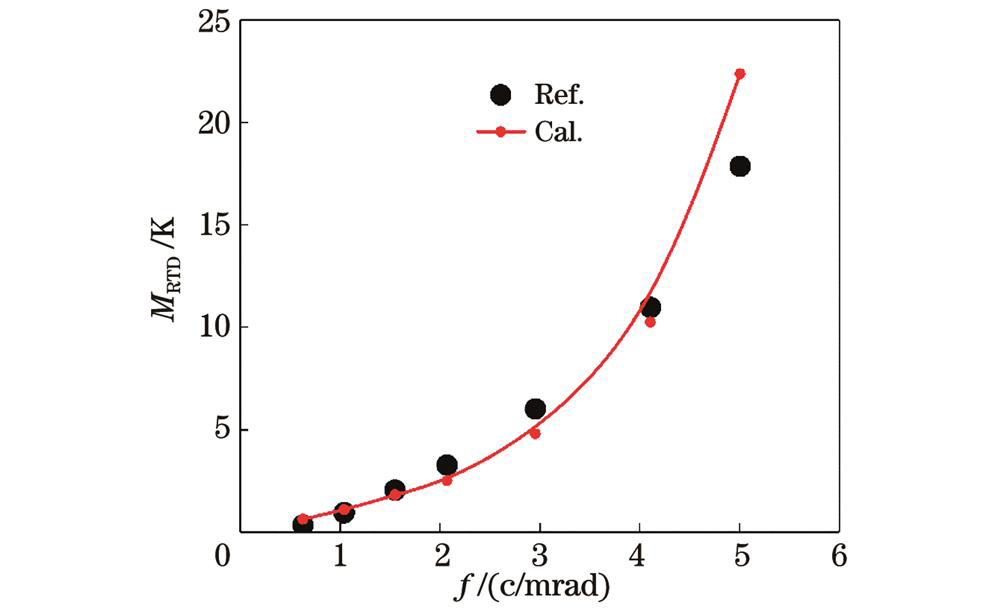
Fig. 1. Comparison results of relationship between spatial frequency and minimum resolvable temperature difference
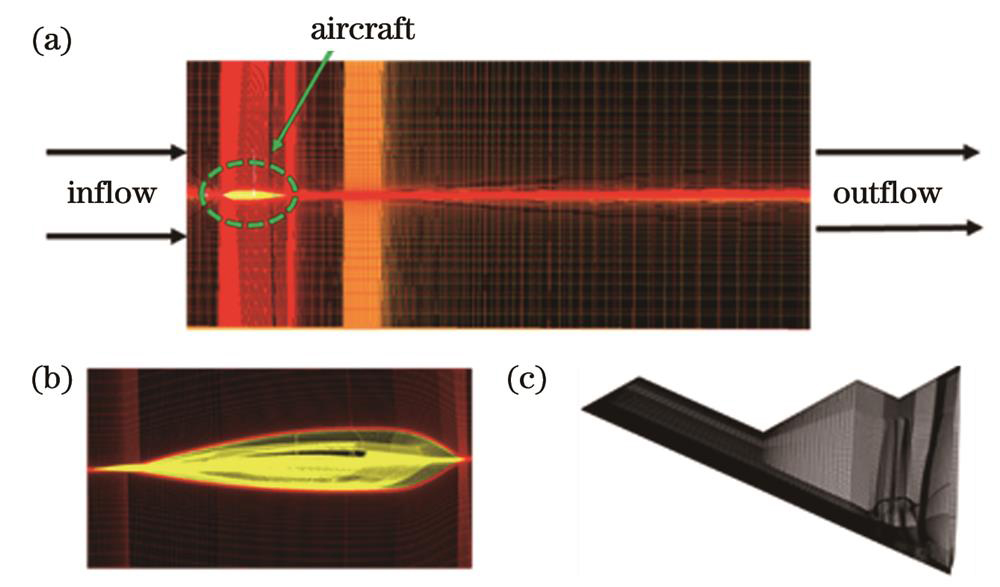
Fig. 2. Computational domain and grid
Fig. 3. Observation schematic diagram of ground-based infrared detection system
Fig. 4. Schematic diagram of representative detection surface of aircraft[22]
Fig. 5. Schematic diagram of atmospheric transmittance
Fig. 6. Contours of aircraft flow field. (a) Pressure of flow field; (b) Mach number of flow field; (c) temperature of flow field
Fig. 7. Radiation intensities at different observation angles within detection surface 1
Fig. 8. Radiation intensities at different observation angles within detection surface 2
Fig. 9. Maximum detection range in long wave band of detection surface 1
Fig. 10. Maximum detection range in medium wave band of detection surface 1
Fig. 11. Maximum detection range in long wave band of detection surface 2
Fig. 12. Maximum detection range in medium wave band of detection surface 2
Fig. 13. Maximum observation range of ground-based infrared system
Fig. 14. Maximum observation range of MRTD visual range prediction model at different observation levels
|
Table 1. Comparison of calculation results of MDTD visual range prediction model
|
Table 2. Performance parameter of Catherine-GP[23]
|
Table 3. Number of half cycles (ne) corresponding to different observation levels

Set citation alerts for the article
Please enter your email address
© Copyright 2018-2021 | Chinese Laser Press. All Rights Reserved 沪ICP备15018463号-20