• Acta Optica Sinica
  • Vol. 42, Issue 19, 1928001 (2022)
Zhengang Li1、2, Jiaxiang Liu1, Ganshang Si1、2, Zhiqiang Ning1、2, Yonghua Fang1、2、*, and Ying Pan1
Author Affiliations
  • 1Key Laboratory of Environmental Optics and Technology, Anhui Institute of Optics and Fine Mechanics, Hefei Institutes of Physical Science, Chinese Academy of Sciences, Hefei 230031, Anhui , China
  • 2University of Science and Technology of China, Hefei 230026, Anhui , China
  • show less
    DOI: 10.3788/AOS202242.1928001 Cite this Article Set citation alerts
    Zhengang Li, Jiaxiang Liu, Ganshang Si, Zhiqiang Ning, Yonghua Fang, Ying Pan. T-Type Photoacoustic Sensor Based on Multiple Reflection of Light Beams[J]. Acta Optica Sinica, 2022, 42(19): 1928001 Copy Citation Text show less
    Four kinds of light beam excitation models. (a) Single excitation-pass; (b) signal excitation-reflection; (c) multiple excitation-pass; (d) multiple excitation-reflection
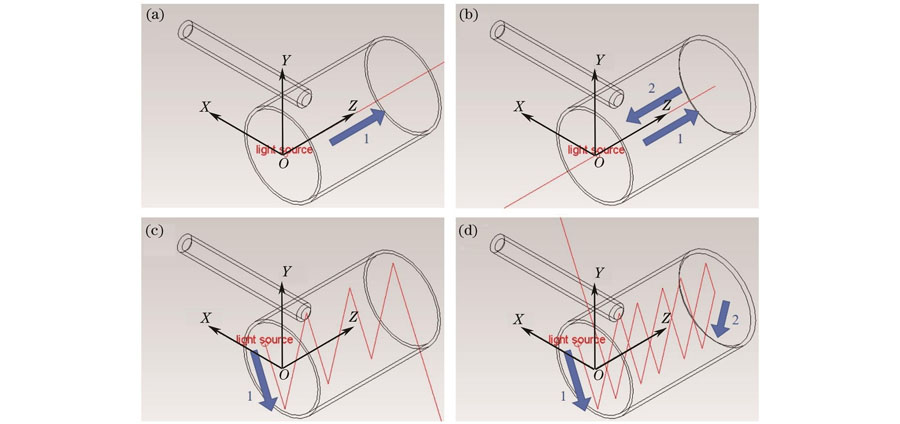
    Fig. 1. Four kinds of light beam excitation models. (a) Single excitation-pass; (b) signal excitation-reflection; (c) multiple excitation-pass; (d) multiple excitation-reflection
    Section diagram of multiple excitation-pass model
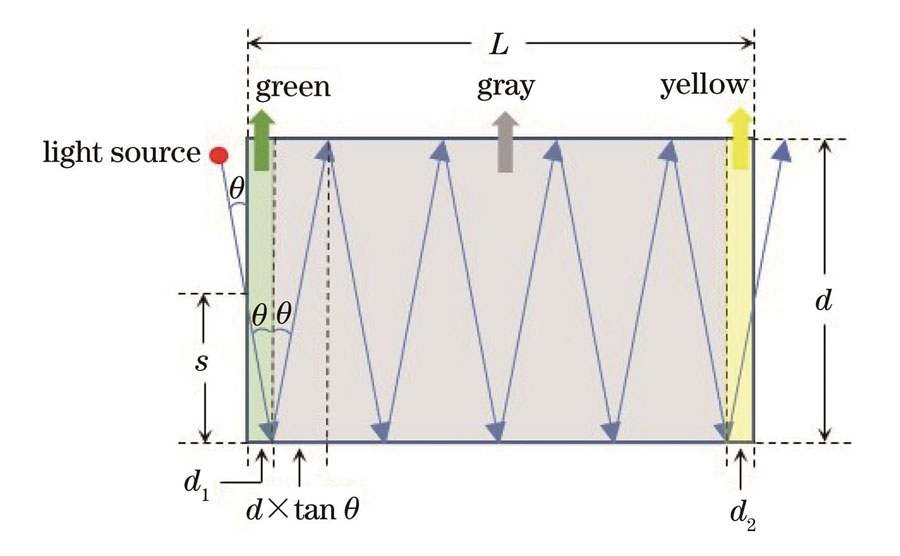
    Fig. 2. Section diagram of multiple excitation-pass model
    Section diagram and equivalent optical path diagram of multiple excitation-reflection model.(a) Section diagram;(b) equivalent optical path diagram
    Fig. 3. Section diagram and equivalent optical path diagram of multiple excitation-reflection model.(a) Section diagram;(b) equivalent optical path diagram
    Schematic diagram of multiple reflection excitation mode
    Fig. 4. Schematic diagram of multiple reflection excitation mode
    Finite element simulation model of photoacoustic cell. (a) Geometric model; (b) light beam energy distribution
    Fig. 5. Finite element simulation model of photoacoustic cell. (a) Geometric model; (b) light beam energy distribution
    Sound pressure distribution and sound frequency characteristic curve of first-order longitudinal resonance mode of photoacoustic cell. (a) Sound pressure distribution; (b) sound frequency characteristic curve
    Fig. 6. Sound pressure distribution and sound frequency characteristic curve of first-order longitudinal resonance mode of photoacoustic cell. (a) Sound pressure distribution; (b) sound frequency characteristic curve
    Three simulated excitation light beams. (a) Excitation light beam with power density of 0.1 W/kg; (b) excitation light beam with power density of 0.2 W/kg; (c) two excitation light beams with power density of 0.1 W/kg
    Fig. 7. Three simulated excitation light beams. (a) Excitation light beam with power density of 0.1 W/kg; (b) excitation light beam with power density of 0.2 W/kg; (c) two excitation light beams with power density of 0.1 W/kg
    Resonance modes and sound frequency characteristic curves under three simulated excitation light beams. (a) Resonance mode under excitation light beam in Fig. 7(a); (b) resonance mode under excitation light beam in Fig. 7(b); (c) resonance mode under excitation light beam in Fig. 7(c); (d) sound frequency characteristic curves
    Fig. 8. Resonance modes and sound frequency characteristic curves under three simulated excitation light beams. (a) Resonance mode under excitation light beam in Fig. 7(a); (b) resonance mode under excitation light beam in Fig. 7(b); (c) resonance mode under excitation light beam in Fig. 7(c); (d) sound frequency characteristic curves
    Absorption line of CO2 in wavelength range of 2002-2006 nm
    Fig. 9. Absorption line of CO2 in wavelength range of 2002-2006 nm
    Physical diagram of photoacoustic cell
    Fig. 10. Physical diagram of photoacoustic cell
    Schematic diagram of photoacoustic detection device
    Fig. 11. Schematic diagram of photoacoustic detection device
    Measured sound frequency characteristic curve at end of acoustic resonance tube
    Fig. 12. Measured sound frequency characteristic curve at end of acoustic resonance tube
    Second harmonic signals of CO2 under five light beam excitation modes
    Fig. 13. Second harmonic signals of CO2 under five light beam excitation modes
    Concentration calibration curve of photoacoustic detection device
    Fig. 14. Concentration calibration curve of photoacoustic detection device
    Allan variance curve under long-time detection
    Fig. 15. Allan variance curve under long-time detection
    Light beam excitation modeEquivalent absorption path /cm
    Single excitation-pass (mode 1)5.0
    Single excitation-reflection (mode 2)9.9
    Multiple excitation-pass (mode 3)26.2
    Multiple excitation-reflection (mode 4)50.3
    Multiple reflection (mode 5)229.6
    Table 1. Equivalent absorption paths of different light beam excitation modes
    Light beam excitation modeVsignal /µVσ /µVSNRImprovement of SNR
    Single excitation-pass3.81700.0851451.0
    Single excitation-reflection7.36340.1041711.6
    Multiple excitation-pass15.55810.09091713.8
    Multiple excitation-reflection29.80020.10812766.1
    Multiple reflection78.04830.118865714.6
    Table 2. SNRs under five light beam excitation modes
    Light beam excitation modeVLoD /10-6VNNEA /(10-9 cm-1·W·Hz-1/2
    Single excitation-pass222177.2
    Single excitation-reflection141112.6
    Multiple excitation-pass5846.3
    Multiple excitation-reflection3628.7
    Multiple reflection1511.9
    Table 3. LoD and NNEA under five beam excitation modes
    Zhengang Li, Jiaxiang Liu, Ganshang Si, Zhiqiang Ning, Yonghua Fang, Ying Pan. T-Type Photoacoustic Sensor Based on Multiple Reflection of Light Beams[J]. Acta Optica Sinica, 2022, 42(19): 1928001
    Download Citation