
Anguo Dong, Hongchao Liu, Qian Zhang, Miaomiao Liang. Hyperspectral Remote Sensing Image Classification Based on Auto-Encoder[J]. Laser & Optoelectronics Progress, 2019, 56(19): 192801
- Laser & Optoelectronics Progress
- Vol. 56, Issue 19, 192801 (2019)
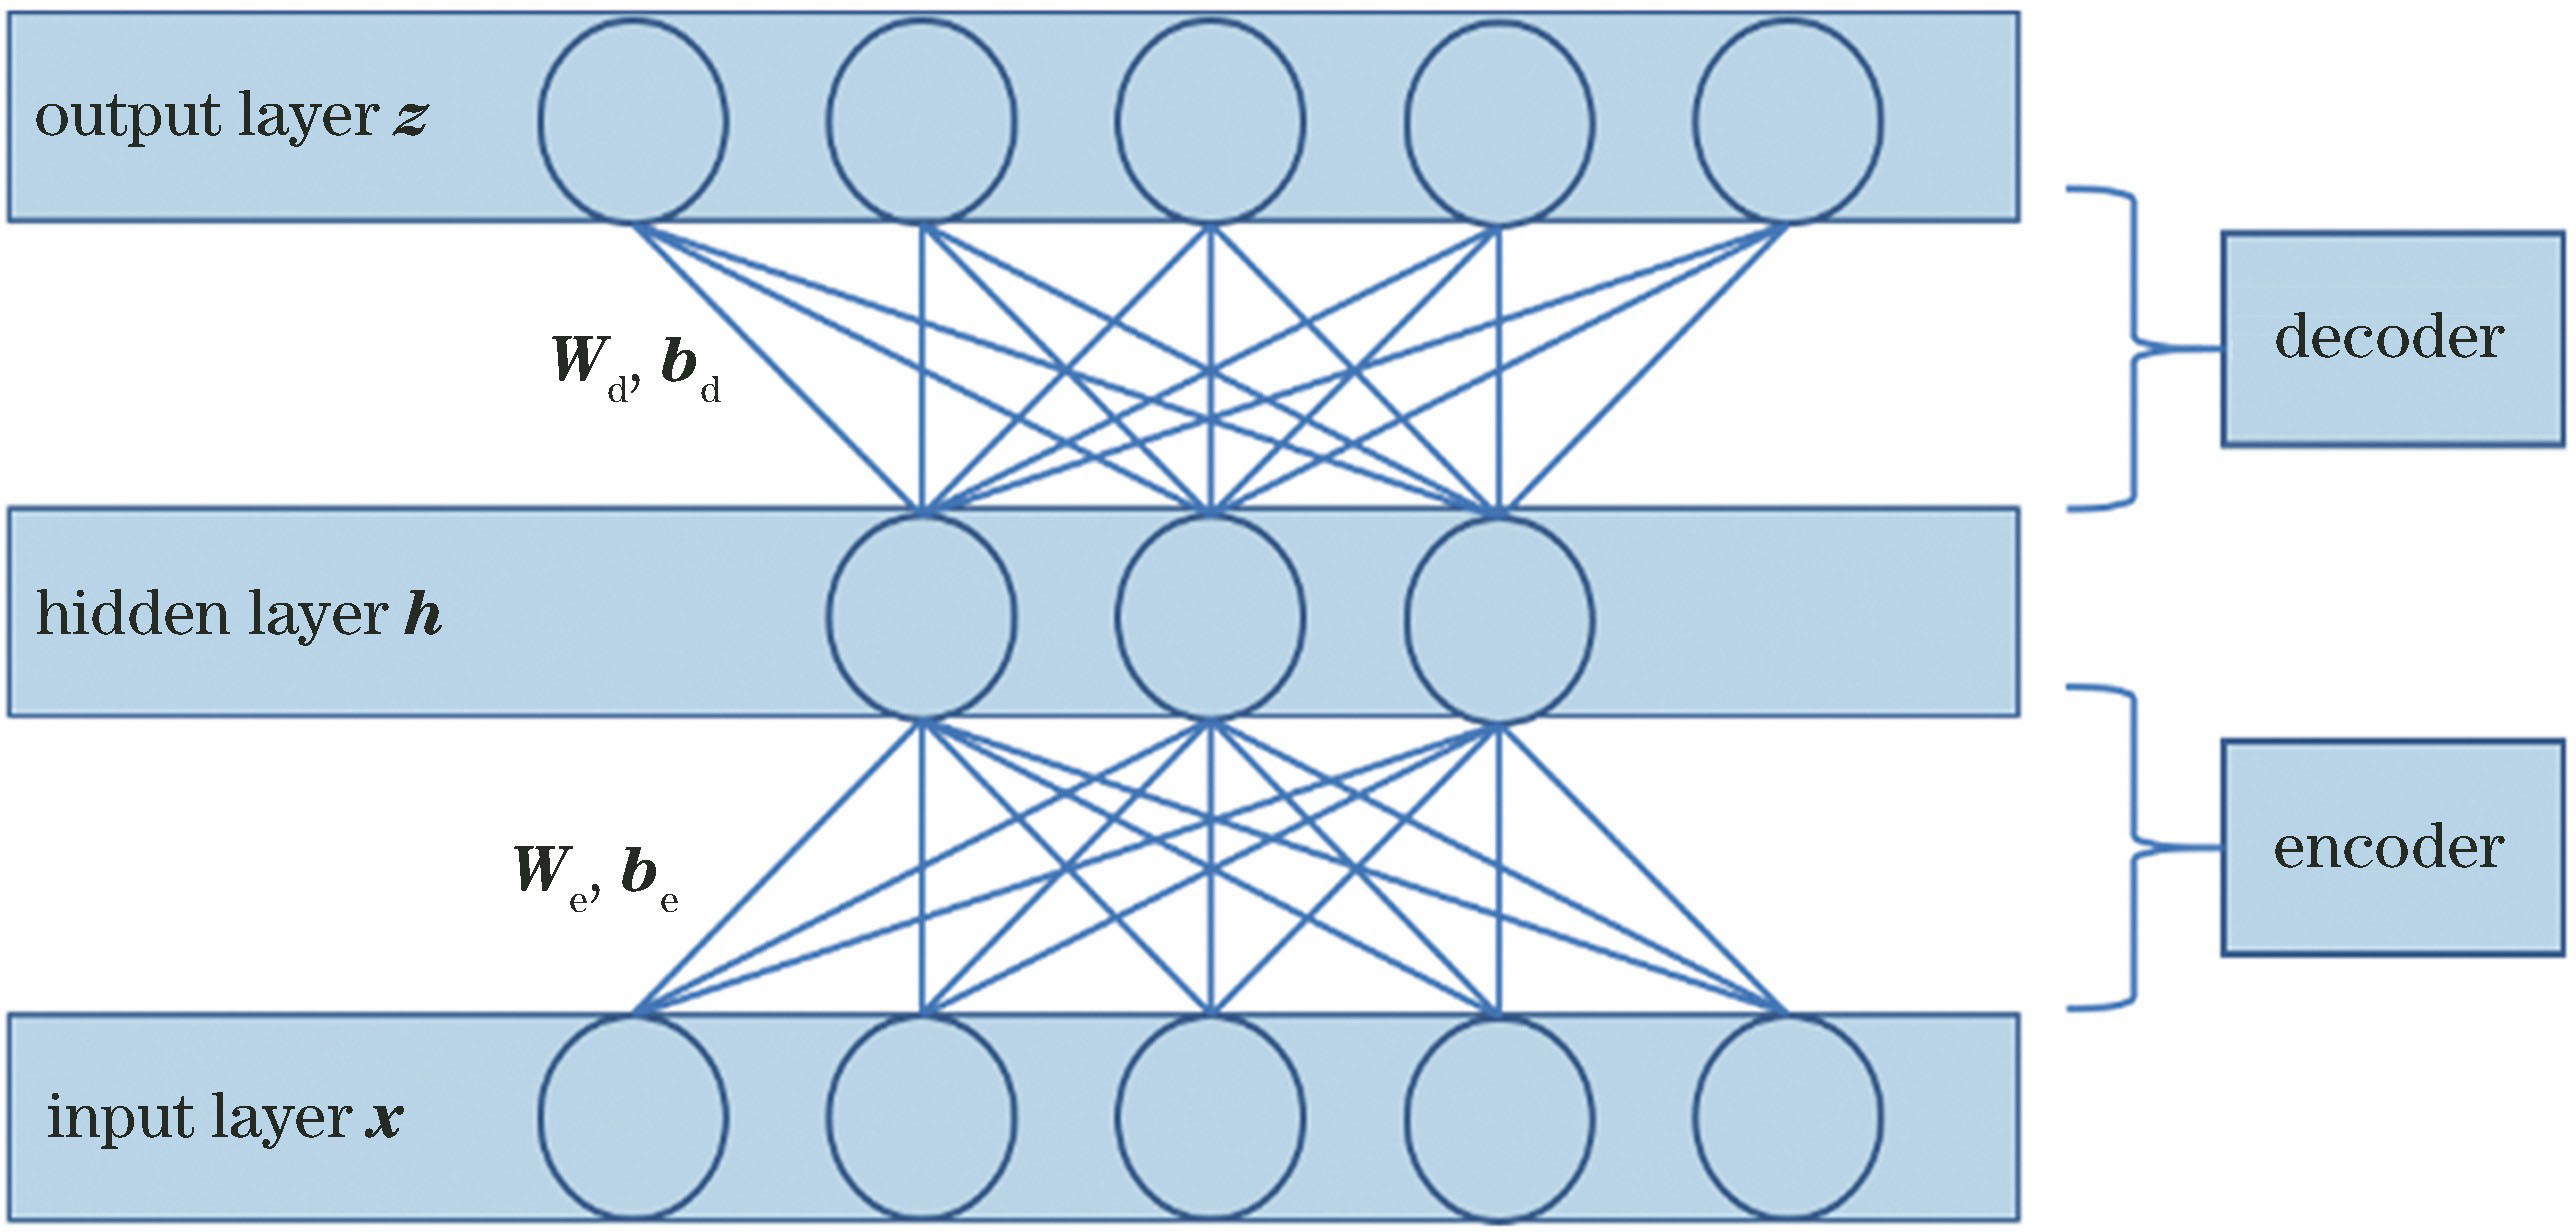
Fig. 1. Auto-encoder model
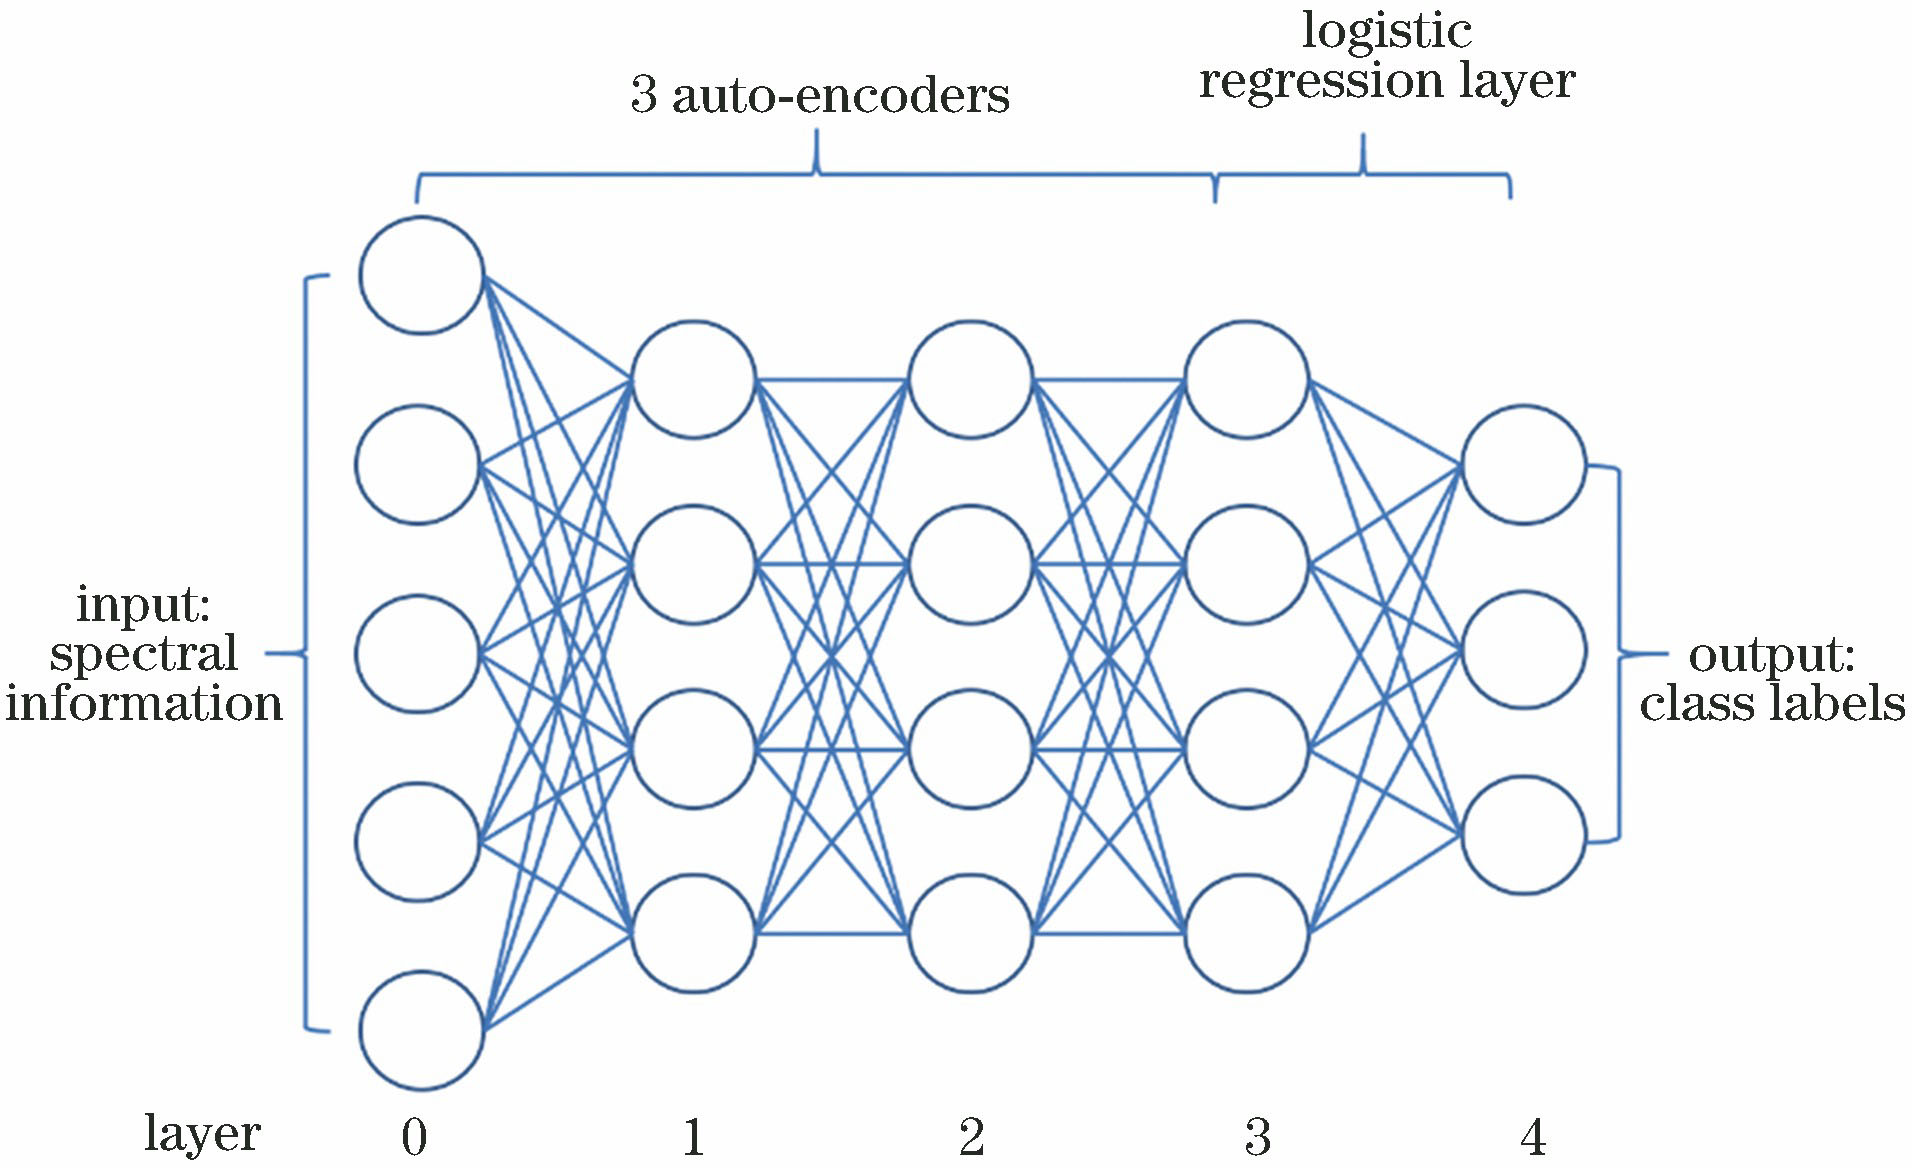
Fig. 2. Stack auto-encoder and classifier
Fig. 3. Hyperspectral remote sensing images. (a) True classification picture; (b) classification result of S-SAE algorithm; (c) spectral curves
Fig. 4. Spatial-spectral feature extraction method based on rotation invariant property
Fig. 5. Hyperspectral neighborhood information. (a) Spatial position; (b) magnified picture; (c) neighborhood information of point E; (d) neighborhood information of point F
Fig. 6. Classification algorithm framework for deep learning combined with spatial-spectral information
Fig. 7. Selection of parameters. (a) Selection of number of principal components; (b) selection of window size
Fig. 8. Classification results of Pavia University dataset obtained by different algorithms. (a) Original image; (b) true classification picture; (c) SVM; (d) CK-SVM; (e) OMP; (f) SOMP; (g) proposed method (unselect); (h) proposed method
Fig. 9. Classification results of Indian Pines dataset obtained by different algorithms. (a) Original image; (b) true classification picture; (c) SVM; (d) CK-SVM; (e) OMP; (f) SOMP; (g) proposed method (unselect); (h) proposed method
Fig. 10. Effect of number of training samples on overall accuracy of different datasets. (a) Pavia University; (b) Indian Pines
| ||||||||||||||||||||||||||||||||||||||||||||||||||||||||||||||||||||||||||||||||||||||||||||||||||||||||||||||||||||
Table 1. Experimental data and classification accuracy of the Pavia University dataset
| |||||||||||||||||||||||||||
Table 2. OA and Kappa coefficient of the Indian Pines dataset obtained by different algorithms

Set citation alerts for the article
Please enter your email address
© Copyright 2018-2021 | Chinese Laser Press. All Rights Reserved 沪ICP备15018463号-20