
Xiaoyu Shi, Daosheng Wen, Shouren Wang, Gaoqi Wang, Mingyuan Zhang. Microstructures and High-Temperature Friction and Wear Properties of Laser Cladded Fe-Ni-Cr Gradient Composite Coating for Brake Disc[J]. Chinese Journal of Lasers, 2022, 49(2): 0202017
- Chinese Journal of Lasers
- Vol. 49, Issue 2, 0202017 (2022)
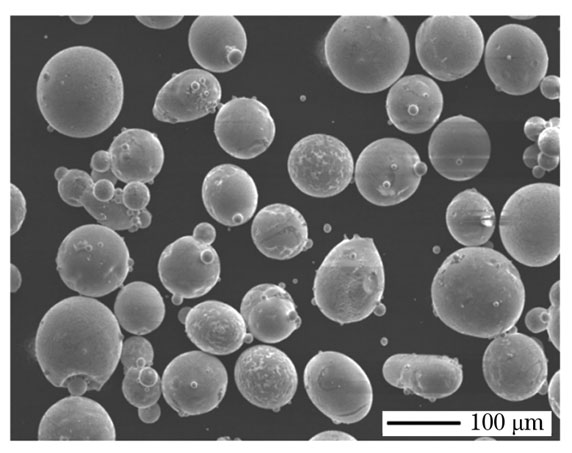
Fig. 1. Micro-morphology of cladding powder
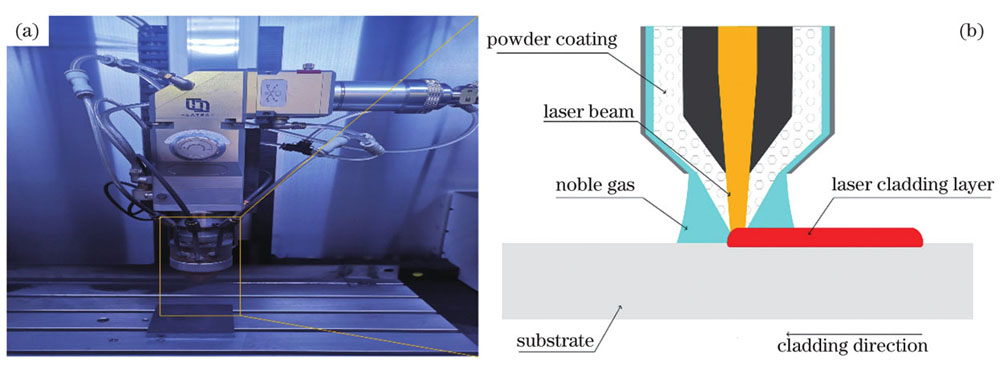
Fig. 2. Laser cladding experiment. (a) Laser cladding equipment; (b) laser cladding principle
Fig. 3. Diagram of brake disc cladding layer
Fig. 4. XRD patterns of each part of coating
Fig. 5. Carbide gradient distribution schematic
Fig. 6. Microstructures of each part of gradient coating. (a) Whole view of cross-section; (b) enlarged area A;(c) enlarged area B; (d) enlarged area C
Fig. 7. TEM morphologies of heat-affected zone. (a) TEM morphology at low magnification; (b) TEM morphology at high magnification; (c) selected area electron diffraction (SAED) of region 1; (d) SAED of region 2
Fig. 8. Element distribution of coating cross-section by linear sweep
Fig. 9. Microhardness of coating cross-section
Fig. 10. Friction coefficient of substrate and coating at different temperatures. (a) Substrate; (b) coating
Fig. 11. Volume loss of substrate and coating at different temperatures
Fig. 12. Wear appearances of substrate at different temperatures. (a) RT; (b) 100 ℃;(c) 200 ℃;(d) 300 ℃
Fig. 13. Schematics of wear mechanism. (a) Early wear; (b) abrasive wear; (c) adhesive wear; (d) oxidative wear
Fig. 14. Wear appearances of coating at different temperatures. (a) RT; (b) 100 ℃;(c) 200 ℃;(d) 300 ℃
Fig. 15. Cross-section microstructures of coating after high temperature friction and wear test. (a) 200 ℃;(b) 300 ℃
| |||||||||||||||||||||||||||||||||||
Table 1. Main chemical composition of gray cast iron and cladding powder
|
Table 2. Technological parameters of laser cladding test
|
Table 3. Friction and wear test parameters
|
Table 4. Parallel quantitative calculation results of phases
| |||||||||||||||||||||||||||||||||||||||
Table 5. EDS analysis of worn substrate surface
| |||||||||||||||||||||||||||||||||||||||||||||||||
Table 6. EDS analysis of coating wear surface

Set citation alerts for the article
Please enter your email address
© Copyright 2018-2021 | Chinese Laser Press. All Rights Reserved 沪ICP备15018463号-20