
Zheng Zhang, Yang Xu. Adaptive One-Hand and Two-Hand Gesture Recognition Based on Double Classifiers[J]. Laser & Optoelectronics Progress, 2021, 58(2): 0210005
- Laser & Optoelectronics Progress
- Vol. 58, Issue 2, 0210005 (2021)
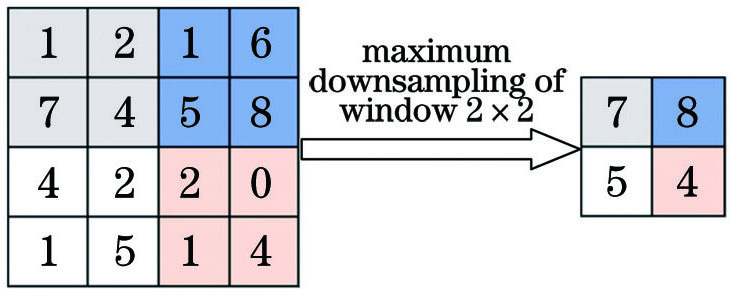
Fig. 1. Maximum pooling example
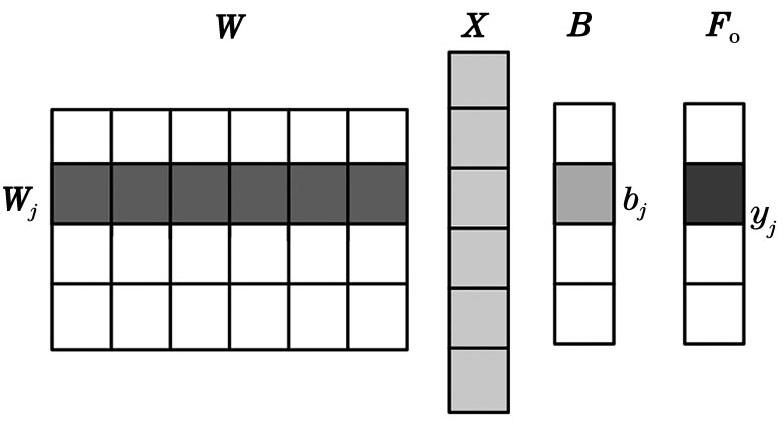
Fig. 2. Classification process for jth category
Fig. 3. One-hand and double-hand gesture recognition structure based on two classifiers
Fig. 4. Network structure of hand number classifier
Fig. 5. Calculation of distance between centers of gavity of hand gestures
Fig. 6. Diagrams of gesture grouping prediction. (a) Gesture binary graphs; (b) centers of gravity of hand gestures; (c) gesture grouping prediction maps
Fig. 7. Adaptive enhanced convolutional neural network structure
Fig. 8. Nine types of gesture samples from ASL
Fig. 9. Samples of one-hand and double-hand gesture data sets. (a) One-hand gestures; (b) double-hand gestures
Fig. 10. Data expansion and complex background gesture samples. (a) Complex background gestures; (b) data expansion
Fig. 11. Convergence and error rate curves of CNN and AE-CNN. (a) Convergence curves of CNN, CNN+Dropout,and AE-CNN; (b) error rate curves of CNN and AE-CNN
Fig. 12. LBP features of hand gestures (0,2,5, and 9). (a) LBP feature of zero gesture; (b) LBP feature of two gesture; (c) LBP feature of five gesture; (d) LBP feature of nine gesture
Fig. 13. HOG features of partial gestures and HOG+PCA dimensionality reduction reconstruction maps
Fig. 14. Preprocessing graphs after adding different noise. (a) Normalization of salt and pepper noise; (b) binary map of salt and pepper noise; (c) binary map of Gaussian noise; (d) distribution of Gaussian noise density; (e) normalization of Gaussian noise
|
Table 1. Network parameters of hand number classifier
|
Table 2. Amount of data of classification networks
|
Table 3. Comparison of recognition rate between AE-CNN and other algorithms
| ||||||||||||||||||||||||||||
Table 4. Comparison of recognition rate between Gaussian noise and salt and pepper noise
|
Table 5. Recognition rate of samples under complex background and different lighting conditions

Set citation alerts for the article
Please enter your email address
© Copyright 2018-2021 | Chinese Laser Press. All Rights Reserved 沪ICP备15018463号-20