
Xixi Chen, Tianli Wu, Zhiyong Gong, Yuchao Li, Yao Zhang, Baojun Li, "Subwavelength imaging and detection using adjustable and movable droplet microlenses," Photonics Res. 8, 225 (2020)
- Photonics Research
- Vol. 8, Issue 3, 225 (2020)
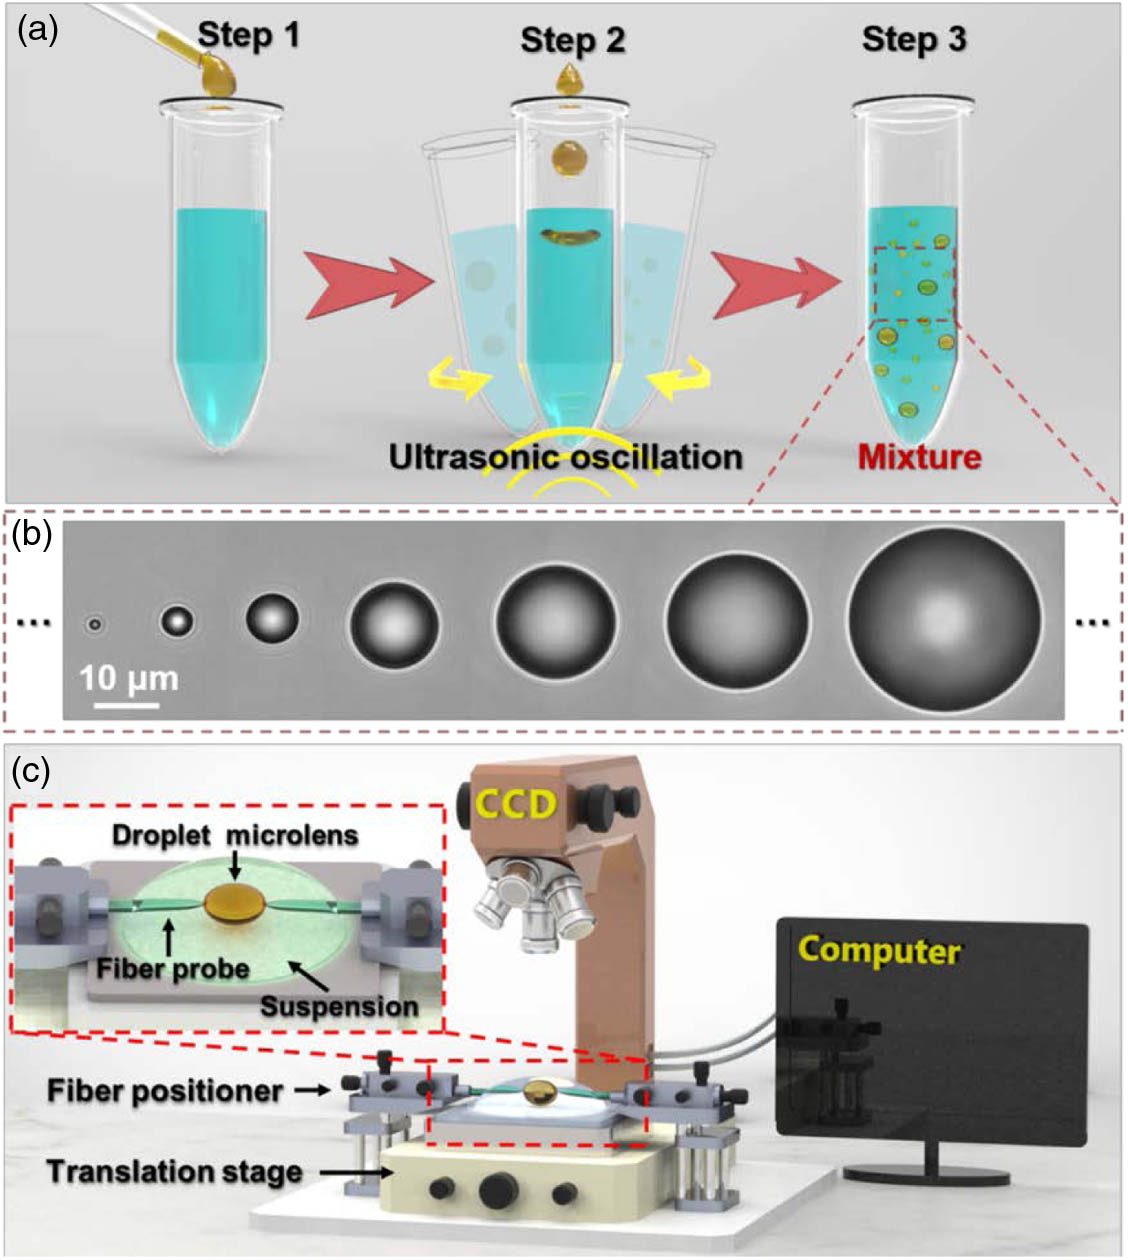
Fig. 1. Droplet preparation and experimental setup. (a) Preparation process of the droplet microlenses. (b) Optical microscope images of the droplet microlenses showing they are spheroids of different sizes. (c) Schematic of the experimental setup. The inset shows a schematic of the microlens deformation.
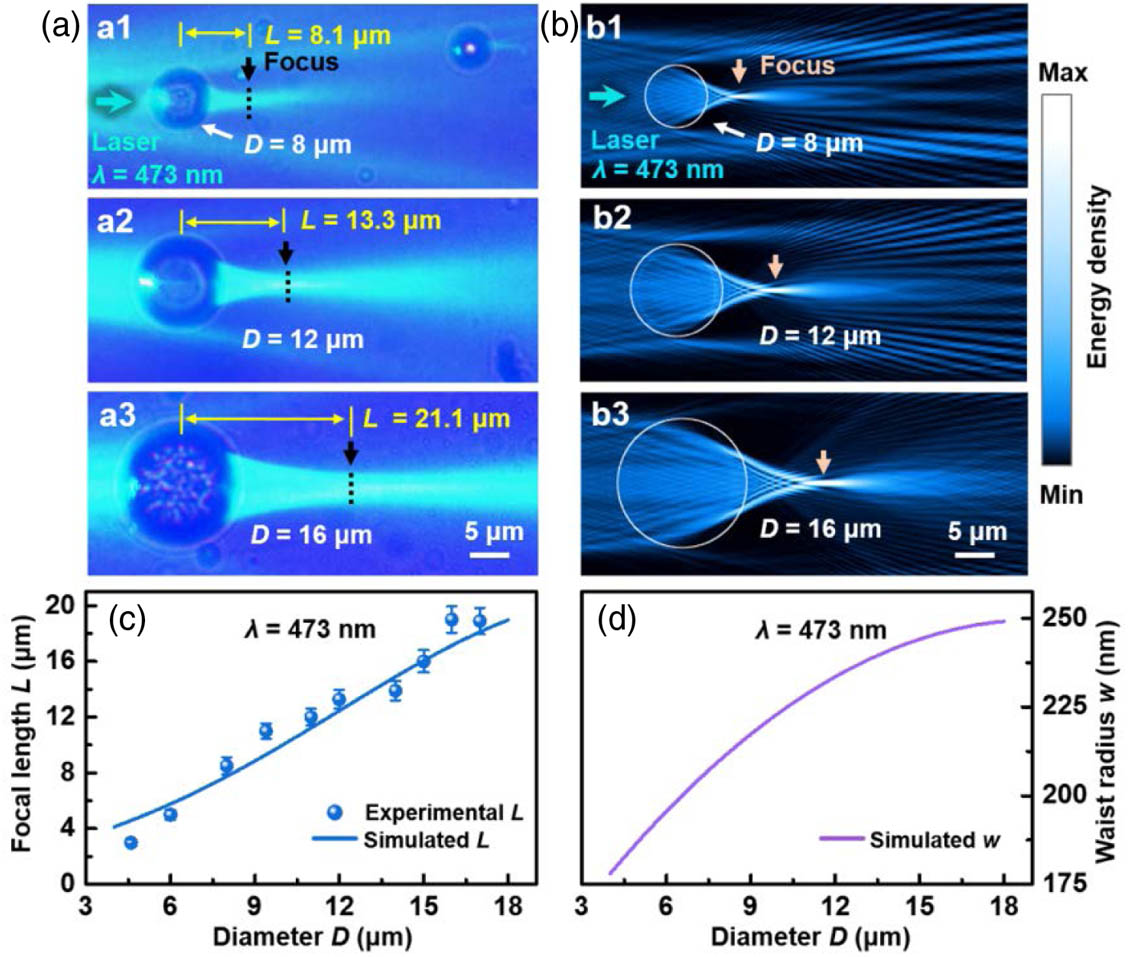
Fig. 2. Focusing of the droplet microlenses in different sizes. (a) Optical microscope images of microlenses with diameters D L D w D
Fig. 3. Focusing of the droplet microlenses of different shapes. (a) Optical microscope images of microlenses with shapes of (a1) a sphere with a diameter D A / B A / B = 1.7 L w A / B
Fig. 5. Subwavelength imaging. (a) Schematic of subwavelength imaging with the droplet microlens. (b) SEM image of the gratings of a commercial Blu-ray Disk (BD). Optical microscope images of the BD gratings with the assistance of droplet microlenses with diameters of (c) 4.8, (d) 7.7, and (e) 13.6 μm. (f) SEM image of the stack of PS nanoparticle layers formed by evaporation-induced assembly. Inset is a magnified view of the PS nanoparticles. (g) Size distribution of the PS nanoparticles. (h) Optical microscope image of the PS nanoparticles obtained with the assistance of a 2 × 2 α β D = 80 nm
Fig. 6. Signal enhancement. (a) Optical microscope images of QD fluorescence enhancement. (a1) A QD cluster was located on the SiO 2 D NA eff D
Fig. 7. Transmittance spectrum of 1-bromonaphthalene (C 10 H 7 Br
Fig. 8. The diameter distribution of the droplet at f = 80 kHz t = 5 min
Fig. 9. Fluctuation region of Brownian motion of trapped microlens (D = 1 μm
Fig. 10. Droplet microlens diameter versus intensity of Raman scattering signals. The fitting method is based on a polynomial fit.


Set citation alerts for the article
Please enter your email address

© Copyright 2018-2021 | Chinese Laser Press. All Rights Reserved 沪ICP备15018463号-20