Author Affiliations
1City University of Hong Kong, Department of Biomedical Engineering, Kowloon, Hong Kong SAR, China2City University of Hong Kong, Shenzhen Research Institute, Shenzhen, Chinashow less
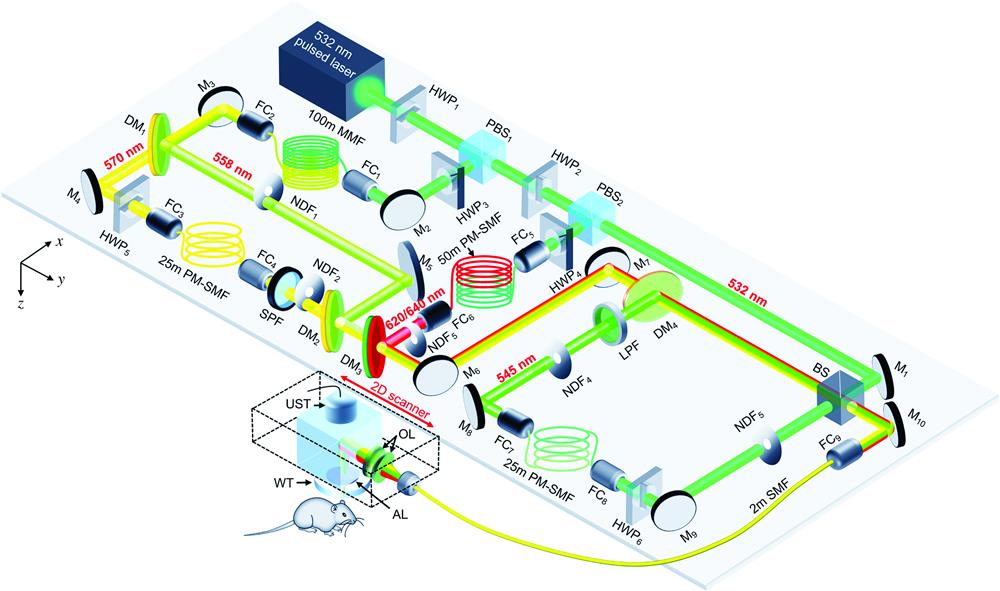
Fig. 1. Schematic of five-wavelength OR-PAM. AL, acoustic lens; BS, beam splitter; R/T, 10/90; , , 565-nm long-pass dichroic mirror; , 600-nm short-pass dichroic mirror; , 550-nm long-pass dichroic mirror; FC, fiber coupler; , half-wave plate; LPF, 537-nm long-pass filter; , mirror; MMF, graded-index multimode fiber; , neutral density filter; OL, optical lens; , polarizing beam splitter; PM-SMF, polarization-maintaining single-mode fiber; SPF, 580-nm short-pass filter; UST, ultrasonic transducer; WT, water tank.
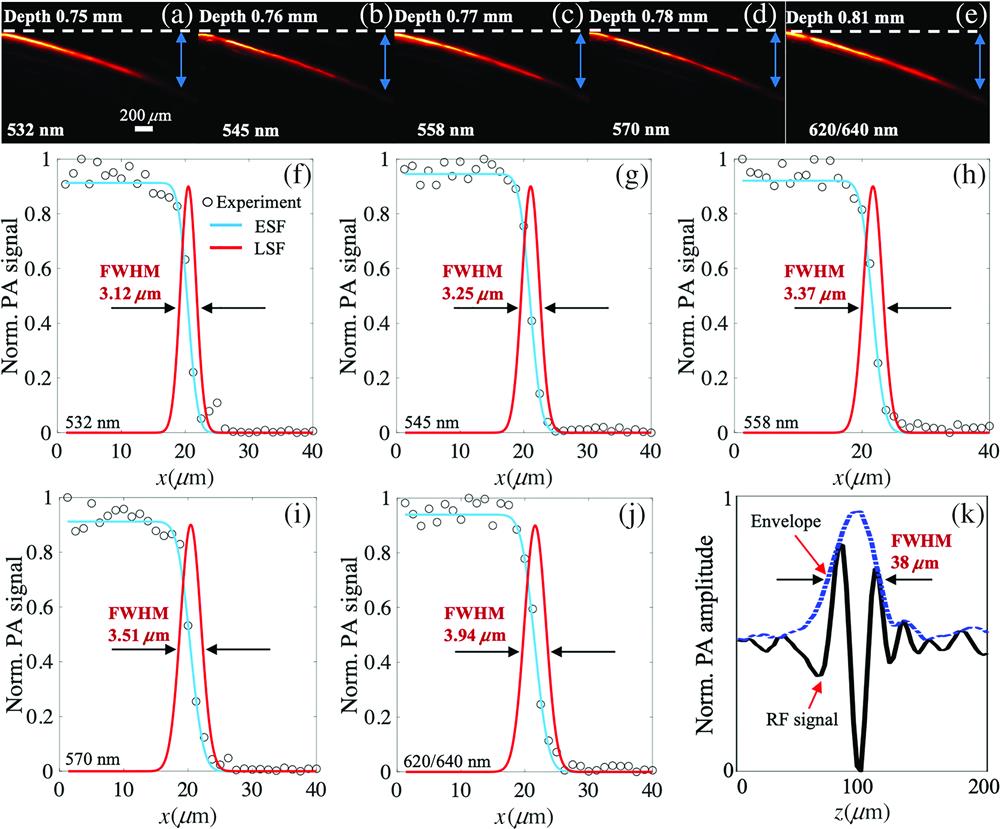
Fig. 2. (a)–(e) Measured penetration depths with 6-dB SNR for 532-, 545-, 558-, 570-, and wavelengths. (f)–(j) Measured lateral resolutions of the five wavelengths. (k) Axial resolution measured via imaging a -diameter tungsten filament.
Fig. 3. (a) Spectrum of the five-wavelength stimulated-Raman-scattering laser. (b) Absorption spectra of , HbR, and EB.
Fig. 4. Five-wavelength OR-PAM of the blood and lymphatic vessels in the mouse ear. The imaging area is . (a) Compensated oxygen saturation. (b) Blood flow speed determined with the dual-pulse method. The profiles of five arteries and six veins are labeled with white dashed lines. (c) PAM imaging of the blood and lymphatic vessels. (d) Variation of oxygen saturation, blood flow speed, and relative lymphatic concentration from the root to the tip of the mouse ear. A, arteries; V, veins; L, lymphatic vessels. Along the arteries and veins, the first value is compensated oxygen saturation, and the second value is blood flow speed (mm/s). (e) The averaged diameter () of arteries and veins profiles labeled in (b). (f) The averaged flow rate () of arteries and veins profiles labeled in (b). Data are presented as , and the mean values are labeled in the figure.
Fig. 5. (a)–(f) OR-PAM of hemoglobin concentration, oxygen saturation, blood flow speed, depth, diameter, and tortuosity in the tumor region. (g)–(i) Simultaneous imaging of hemoglobin and dye concentrations at 0, 10, and 20 min after EB dye injection. (j)–(l) In vivo brain imaging of hemoglobin concentration, oxygen saturation, and blood flow speed.
Wavelength (nm) | Pulse energy (nJ) | Delay time (ns) | Pulse energy fluctuation (SD) (%) | Relative pulse energy fluctuation (SD) (%) | Pulse energy drift in an hour (%) | w/o C&T | w C&T | w/o C&T | w C&T | w/o C&T | w C&T | 532 | 100 | 0 | 5.71 | 5.45 | — | — | 5.12 | 4.55 | 545 | 100 | 139 | 8.22 | 7.15 | 7.78 | 7.01 | 7.63 | 6.04 | 558 | 100 | 510 | 10.35 | 8.49 | 8.29 | 7.23 | 9.58 | 7.49 | 570 | 90 | 631 | 10.98 | 8.78 | 8.95 | 7.68 | 10.42 | 7.96 | 620/640 | 300 | 260 | 7.54 | 6.85 | — | — | 6.70 | 5.45 |
|
Table 1. Pulse energy, delay time, pulse energy fluctuation, and drift of the five wavelengths. C&T represents airflow isolation and temperature control.