• Acta Optica Sinica
  • Vol. 44, Issue 3, 0322004 (2024)
Yang Liu1、2, Bo Li1、*, Guochao Gu1, Hanshuang Li1, and Xiaoxu Wang1
Author Affiliations
  • 1Changchun Institute of Optics, Fine Mechanics and Physics, Chinese Academy of Sciences, Changchun 130033, Jilin, China
  • 2University of Chinese Academy of Sciences, Beijing 100049, China
  • show less
    DOI: 10.3788/AOS231623 Cite this Article Set citation alerts
    Yang Liu, Bo Li, Guochao Gu, Hanshuang Li, Xiaoxu Wang. Design of Light and Small Short-Wave Infrared Auto-Collimation Hyperspectral Resolution Imaging Spectrometer[J]. Acta Optica Sinica, 2024, 44(3): 0322004 Copy Citation Text show less
    System structure diagram
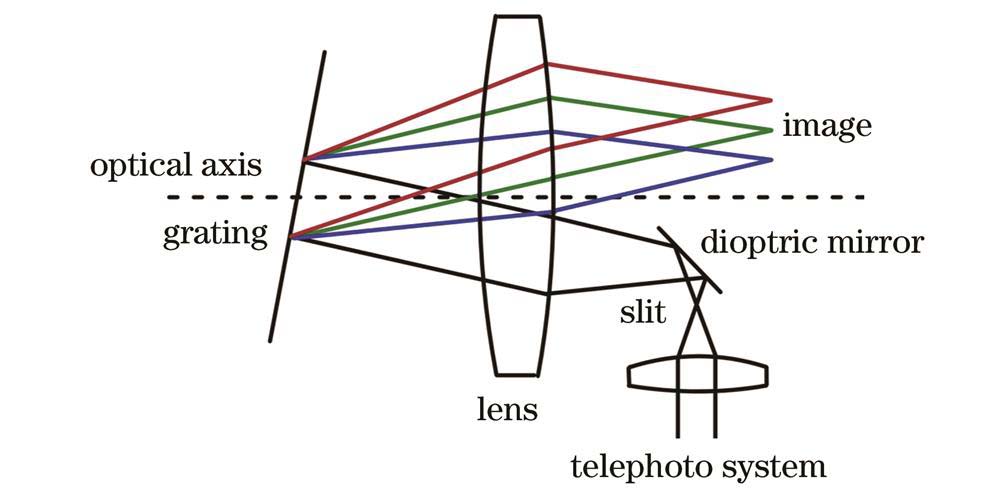
    Fig. 1. System structure diagram
    Schematic diagram of spectral imaging system
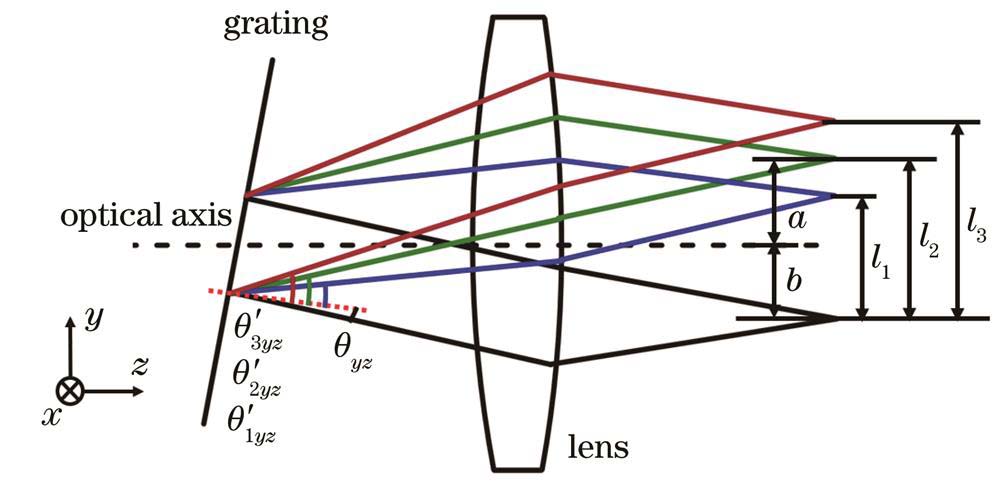
    Fig. 2. Schematic diagram of spectral imaging system
    Light diagram of grating surface
    Fig. 3. Light diagram of grating surface
    Design results of telescope system. (a) Two-dimensional graph; (b) three-dimensional graph
    Fig. 4. Design results of telescope system. (a) Two-dimensional graph; (b) three-dimensional graph
    MTF curves of telescope system
    Fig. 5. MTF curves of telescope system
    RMS of telescope system
    Fig. 6. RMS of telescope system
    Design results of auto-collimation system. (a) Two-dimensional graph; (b) three-dimensional graph
    Fig. 7. Design results of auto-collimation system. (a) Two-dimensional graph; (b) three-dimensional graph
    MTF curves of auto-collimation system at different wavelenghs. (a) 1610 nm; (b) 1625 nm; (c) 1640 nm
    Fig. 8. MTF curves of auto-collimation system at different wavelenghs. (a) 1610 nm; (b) 1625 nm; (c) 1640 nm
    RMS of auto-collimation system at different wavelenghs. (a) 1610 nm; (b) 1625 nm; (c) 1640 nm
    Fig. 9. RMS of auto-collimation system at different wavelenghs. (a) 1610 nm; (b) 1625 nm; (c) 1640 nm
    Design results of imaging spectrometer. (a) Two-dimensional graph; (b) three-dimensional graph
    Fig. 10. Design results of imaging spectrometer. (a) Two-dimensional graph; (b) three-dimensional graph
    MTF curves of imaging spectrometer at different wavelenghs. (a) 1610 nm; (b) 1625 nm; (c) 1640 nm
    Fig. 11. MTF curves of imaging spectrometer at different wavelenghs. (a) 1610 nm; (b) 1625 nm; (c) 1640 nm
    RMS of imaging spectrometer at different wavelenghs. (a) 1610 nm; (b) 1625 nm; (c) 1640 nm
    Fig. 12. RMS of imaging spectrometer at different wavelenghs. (a) 1610 nm; (b) 1625 nm; (c) 1640 nm
    MTF tolerance analysis of imager spectrometer. (a) Tangential plane; (b) sagittal plane
    Fig. 13. MTF tolerance analysis of imager spectrometer. (a) Tangential plane; (b) sagittal plane
    IndexValue
    Wavelength range1610~1640 nm
    F3
    Field of view90°
    Spectral resolution0.1 nm
    Ground sample of distance0.5 m
    Height100 m
    Pixel size of spectral dimension50 μm
    Pixel size of spatial dimension25 μm
    Table 1. Design indexes
    Tolerance typeMinimum valueMaximum value
    Thickness0.02 mm0.5 mm
    Surface displacement0.02 mm0.5 mm
    Class displacement0.02 mm0.5 mm
    Tilt1′17′
    Refractive index0.00010.002
    Radius of curvature0.02 mm1×1010 mm
    Table 2. Tolerance distribution results
    Yang Liu, Bo Li, Guochao Gu, Hanshuang Li, Xiaoxu Wang. Design of Light and Small Short-Wave Infrared Auto-Collimation Hyperspectral Resolution Imaging Spectrometer[J]. Acta Optica Sinica, 2024, 44(3): 0322004
    Download Citation