
Shanshan Liu, Yueheng Li, Ping Huang, Yueyue Tan, Meiyan Ju. Influence of Scattering Phase Function on Detection Performance of Underwater Wireless Optical Communication System[J]. Laser & Optoelectronics Progress, 2021, 58(21): 2129001
- Laser & Optoelectronics Progress
- Vol. 58, Issue 21, 2129001 (2021)
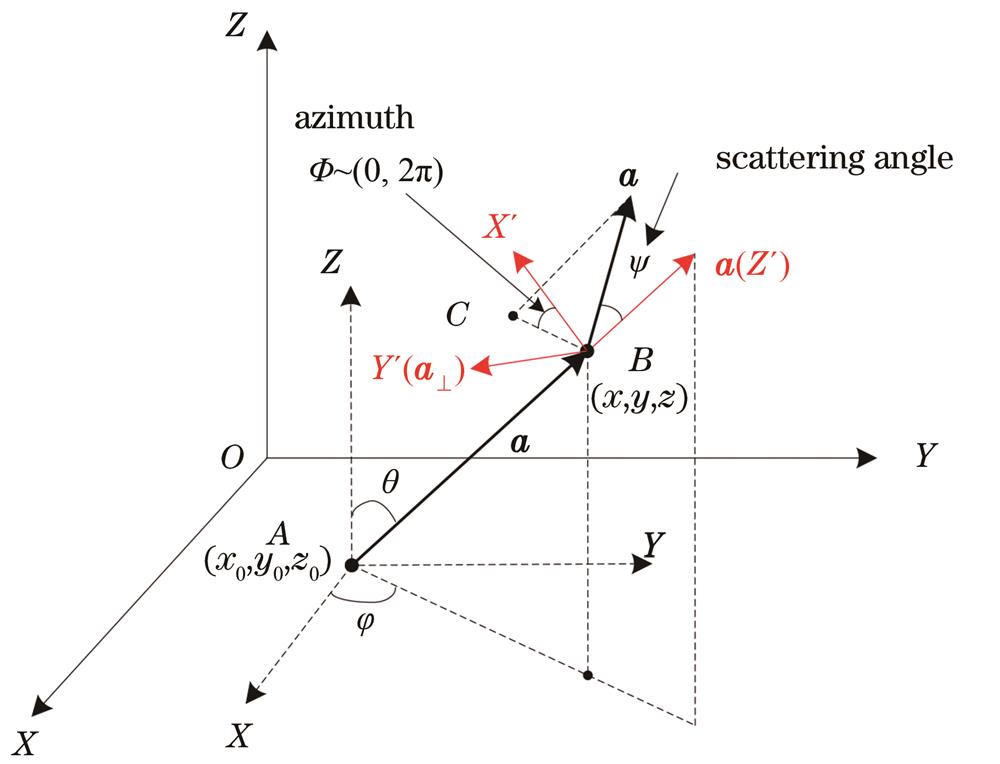
Fig. 1. Schematic diagram of change of pitch-azimuth angle after scattering
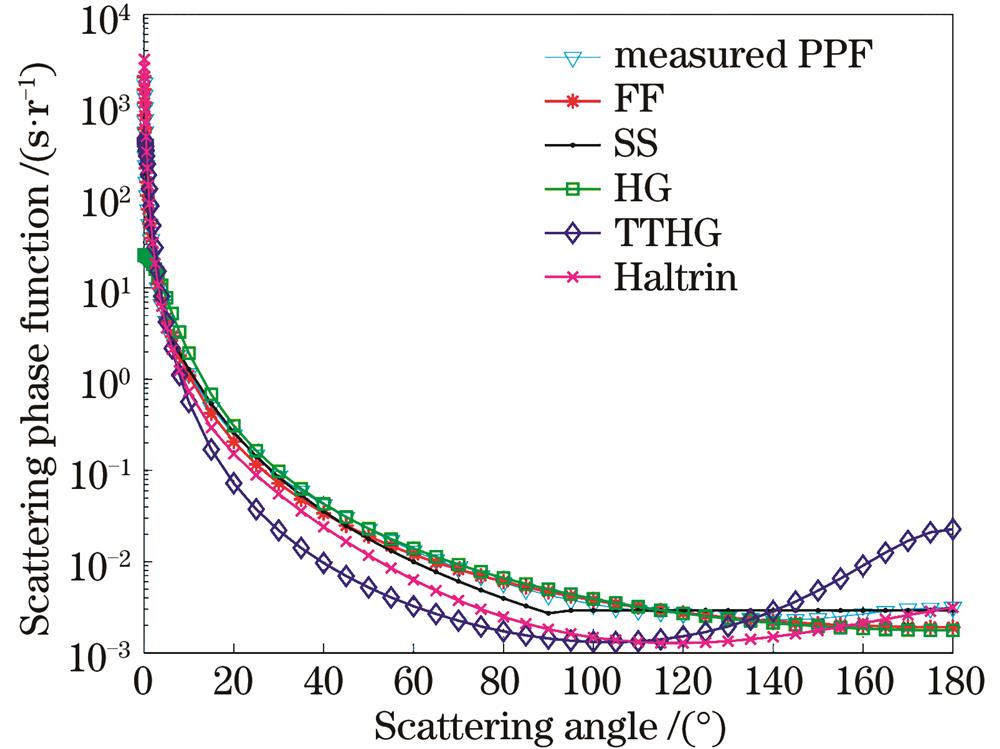
Fig. 2. Semi-logarithmic curves of six phase functions with scattering angle variation
Fig. 3. Total logarithmic curves of six phase functions with scattering angle variation
Fig. 4. Flow chart of Monte Carlo simulation
Fig. 5. CIR simulation curves of different phase functions under clear ocean environment
Fig. 6. CIR simulation curves of different phase functions under offshore coastal environment
Fig. 7. CIR simulation curves of different phase functions under turbid harbor environment
Fig. 8. Flow chart of receiver working [24]
Fig. 9. BER simulation curves of different phase functions under clear ocean environment (MF)
Fig. 10. BER simulation curves of different phase functions under offshore coastal environment (ZF)
Fig. 11. BER simulation curves of different phase functions under turbid harbor environment (ZF)
|
Table 1. Attenuation parameters for different water quality
|
Table 2. Percentage error of root mean square of each phase function and PPF (without factor
|
Table 3. Percentage error of root mean square of each phase function and PPF (with factor
|
Table 4. Summary of main parameters for UWOC BER simulations

Set citation alerts for the article
Please enter your email address
© Copyright 2018-2021 | Chinese Laser Press. All Rights Reserved 沪ICP备15018463号-20