
Yuan Zhao, Haiyang Lu, Cangtao Zhou, Jungao Zhu. Overcritical electron acceleration and betatron radiation in the bubble-like structure formed by re-injected electrons in a tailored transverse plasma[J]. Matter and Radiation at Extremes, 2023, 8(1): 014403
- Matter and Radiation at Extremes
- Vol. 8, Issue 1, 014403 (2023)
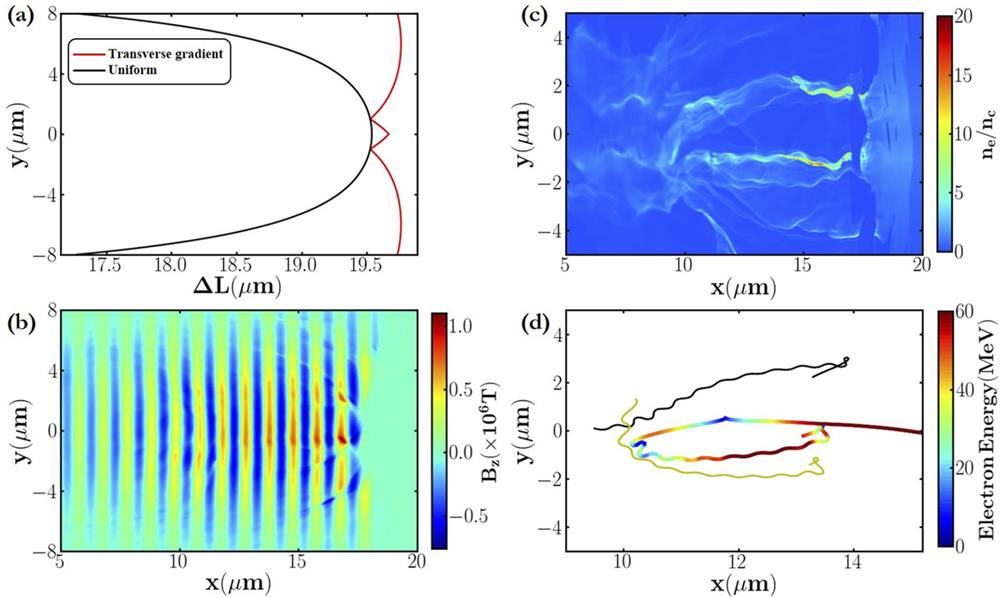
Fig. 1. (a) The phase differences of the plasma wave after 20T 0 passage in a transversely tailored plasma (red solid line) and a uniform plasma (black solid line). The spatial distribution of the transverse magnetic field B z (b) and the backward electron density (c) at 20T 0. (d) A few typical trajectories of the re-injected electrons.
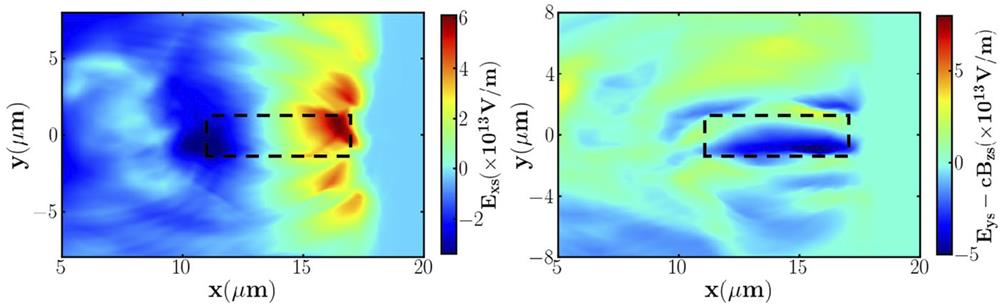
Fig. 2. The spatial distribution of the longitudinal electrostatic field (a) and the transverse field E ys − cB zs in the (x , y ) plane (b) at 20T 0. The black dashed box marks the position of the bubble.
Fig. 3. (a) The Hamiltonian and (b) the electron density distribution in phase space (ψ , γ ). The terms in (6) are normalized with the simulation results for the fields and the electron motion. It follows that eE L /m e ω 0c = 50, eE Sx /m e ω 0c = 9.32, k E = e E S y / m e ω 0 2 = 1 k B = e B S z c / m e ω 0 2 = 1.47 v y = 0.2, and v x = 0.98.
Fig. 4. (a) The spatial distribution of the plasma electron density at 32T 0. (b) and (c) are plots of the on-axis longitudinal electric field E x and the transverse field E y − cB z , respectively. (d) The trajectory of a sample electron and the electromagnetic field that the electron experiences. (e) The evolution of the transverse and longitudinal momenta, normalized by m e c , for the same electron. (f) The work done by the longitudinal and transverse fields. The two vertical dashed black lines in (a)–(c) mark the acceleration zone. The first and second vertical dashed lines in (d)–(f) show the start of the betatron resonance acceleration, while the third dashed line marks the end of the wake-field acceleration. The horizontal dashed line in (b)–(f) gives the zero value of the corresponding quantity.
Fig. 5. (a) The phase space x –p x of electrons inside the bubble at 32T 0. (b) The longitudinal distribution of the electron density at the position with peak electron density. (c) The angular energy of the accelerated electrons. (d) The spectrum of the first electron microbunch.
Fig. 6. (a) The emitted photon density at 32T 0. (b) The evolutions of the local electron oscillation period (black solid line) and the local strength parameter K(red solid line) . (c) The angle energy of the generated photons. (d) The spectrum of photons emitted by the first electron bunch.
|
Table 1. Simulation parameters.


Set citation alerts for the article
Please enter your email address

© Copyright 2018-2021 | Chinese Laser Press. All Rights Reserved 沪ICP备15018463号-20