• Laser & Optoelectronics Progress
  • Vol. 55, Issue 1, 10601 (2018)
Yin Jianjing, Xu Xuemei*, and Ding Yipeng
Author Affiliations
  • School of Physics and Electronics, Central South University, Changsha, Hunan 410083, China
  • show less
    DOI: 10.3788/LOP55.010601 Cite this Article Set citation alerts
    Yin Jianjing, Xu Xuemei, Ding Yipeng. Real-Time Monitoring and Demodulation System of Fiber Bragg Grating Displacement Sensor[J]. Laser & Optoelectronics Progress, 2018, 55(1): 10601 Copy Citation Text show less
    FBG displacement sensor demodulation system
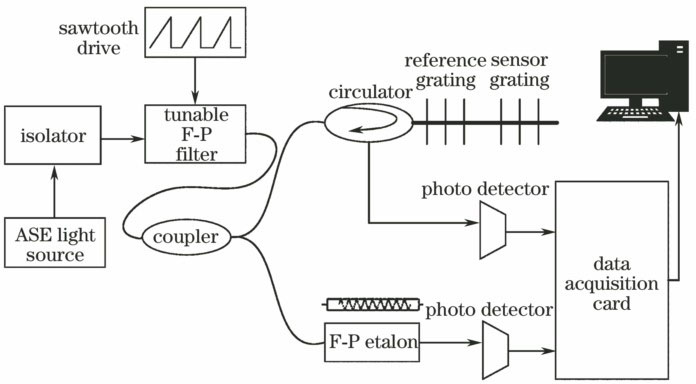
    Fig. 1. FBG displacement sensor demodulation system
    Generation system frame of sawtooth wave
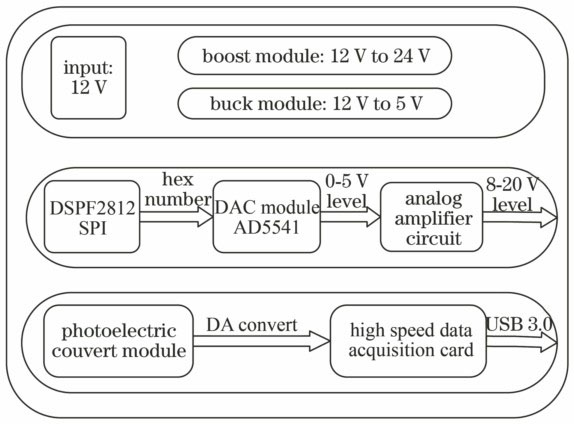
    Fig. 2. Generation system frame of sawtooth wave
    Flow chart of wavelet threshold denoising
    Fig. 3. Flow chart of wavelet threshold denoising
    Effects of wavelet threshold denoising. (a) Original signal; (b) wavelet threshold denosing signal; (c) partial magnification of some peak point in a grating channel for original signal; (d) partial magnification of the peak point for denoising signal
    Fig. 4. Effects of wavelet threshold denoising. (a) Original signal; (b) wavelet threshold denosing signal; (c) partial magnification of some peak point in a grating channel for original signal; (d) partial magnification of the peak point for denoising signal
    Ideal peak shape and double peak shape. (a) Ideal peak shape; (b) double peak shape
    Fig. 5. Ideal peak shape and double peak shape. (a) Ideal peak shape; (b) double peak shape
    Invalid peak shape and left peakshape. (a) Invalid peak shape; (d) left peak shape
    Fig. 6. Invalid peak shape and left peakshape. (a) Invalid peak shape; (d) left peak shape
    Schematic diagrams of Gaussian models. (a) Standard Gaussian curve; (b) asymmetric Gaussian curve
    Fig. 7. Schematic diagrams of Gaussian models. (a) Standard Gaussian curve; (b) asymmetric Gaussian curve
    Effects of Gaussian fitting algorithm. (a) Total peak points after Gaussian fitting and the second processing; (b) partial magnification of some peak point
    Fig. 8. Effects of Gaussian fitting algorithm. (a) Total peak points after Gaussian fitting and the second processing; (b) partial magnification of some peak point
    Photo of FBG demodulation platform
    Fig. 9. Photo of FBG demodulation platform
    Displacement sensor waveform display
    Fig. 10. Displacement sensor waveform display
    Sampleλ2 /nmλ1 /nmX /mmX̅ /mmE /mm
    11552.9871551.012000
    21553.3801550.6203.463.270.19
    31553.7221550.2766.486.230.25
    41554.2911549.70711.4911.360.13
    51554.7671549.23215.6815.420.26
    61554.9981549.00117.7217.500.22
    71555.3231548.67620.5820.320.26
    81553.8281548.17125.0324.720.31
    91556.2581547.74128.82
    101556.5111547.48831.05
    Table 1. Measurement results
    Yin Jianjing, Xu Xuemei, Ding Yipeng. Real-Time Monitoring and Demodulation System of Fiber Bragg Grating Displacement Sensor[J]. Laser & Optoelectronics Progress, 2018, 55(1): 10601
    Download Citation