
Fuqiang Zhou, Xinghua Chai, Tao Ye, Xin Chen. Two-dimensional vision measurement approach based on local sub-plane mapping[J]. Chinese Optics Letters, 2015, 13(12): 121501
- Chinese Optics Letters
- Vol. 13, Issue 12, 121501 (2015)
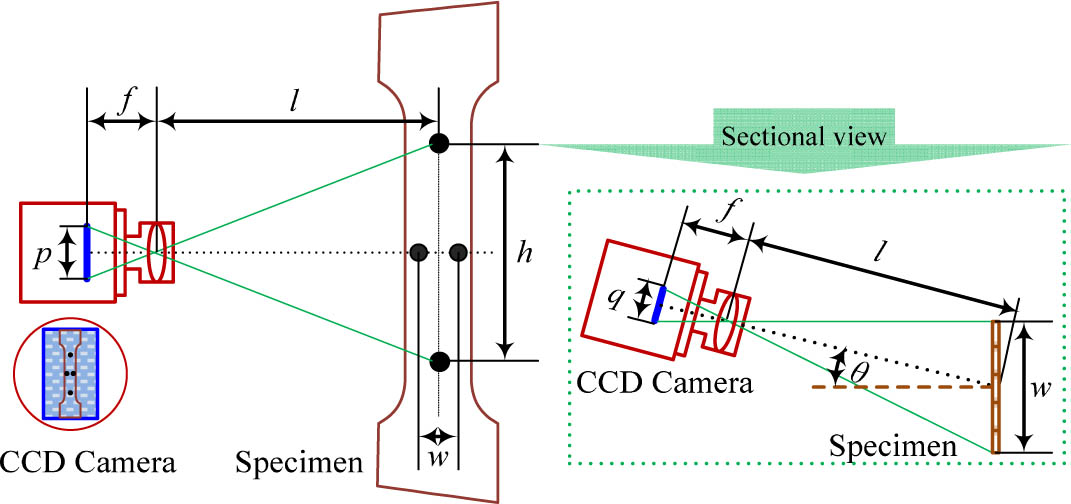
Fig. 1. Video extensometer principle based on 2D vision measurement.
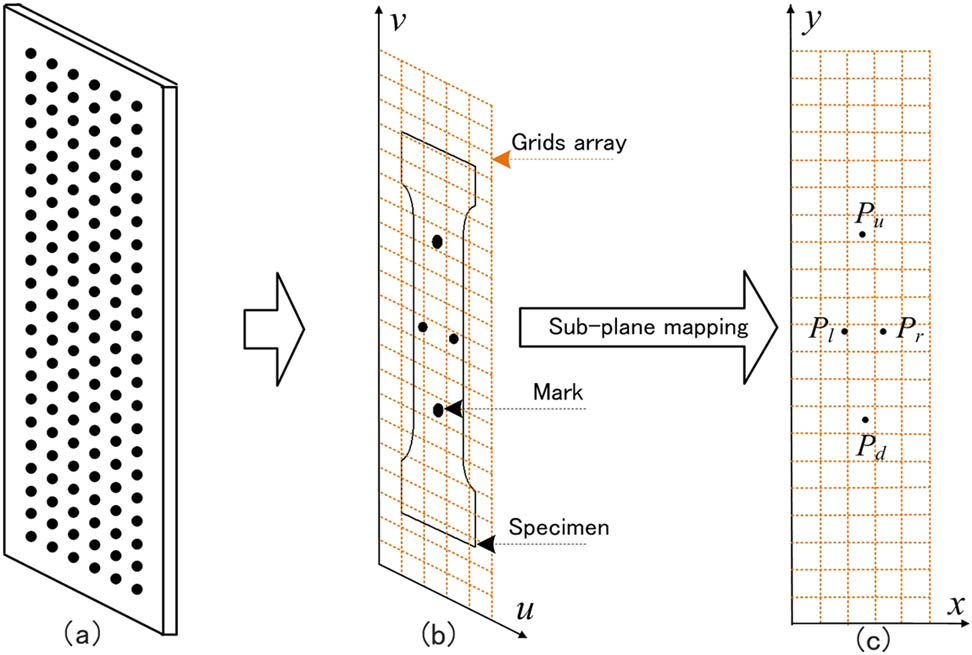
Fig. 2. Process diagram of sub-planes: (a) calibration target with 6 × 22
Fig. 3. Schematic of coordinate location method in sub-plane.
Fig. 4. Effects of the lens distortion: (a) real chessboard image and image with lens distortion and (b) pixel deviations before and after image distortion.
Fig. 5. Relationship between sub-planes interval and mapping accuracy, obtained using lens with first distortion coefficient k 1 = 4.1 × 10 − 8 400 mm × 400 mm
Fig. 6. Principle of the out-plane effects.
Fig. 7. Process of measurement experiment: (a) calibration target fixed on stretching machine, (b) image for calibration, (c) matrix of circular center, (d) displacement measurement using two methods, (e) 81 pixels × 81 pixels correlation subset, and (f) gauge length measurement.
Fig. 8. Comparative results for calibration accuracy using the two methods.
| ||||||||||||||||||||||||||||||||||||||||
Table 1. Comparison of Calibration Accuracy
| ||||||||||||||||||||||||||||||||||||
Table 2. Comparison of Displacement Measurement Accuracy
| ||||||||||||||||||||||||
Table 3. Comparison of Gauge Length Measurement Accuracy

Set citation alerts for the article
Please enter your email address
© Copyright 2018-2021 | Chinese Laser Press. All Rights Reserved 沪ICP备15018463号-20